9/21/22

The FED fails to control inflation. The long-term view

 In January 2022, we wrote in this blog about the strict proportionality between the CPI inflation and the actual interest rate defined by the Board of Governors of the Federal Reserve System, R. This previous post continued the thread of posts related to this issue. Briefly, the cumulative interest rate since the mid-50s is just the cumulative CPI times 1.37. Interestingly, there are periods when the interest rate deviates from the long-term inflation trend, which has been almost linear since 1972. Here, we extend the observational dataset to the period of the quickest inflation rise since the second part of 2021, and discuss the most probable reason why the FRS actually does not control inflation as such by presenting the actual economic force behind price inflation, as we described in a series of papers [e.g., 123, and 4].  Overall, inflation is a linear lagged function of the change in the labor force. The latter is driven by a secular change in the participation rate in the labor force (LFPR) together with a general increase in the working-age population. In other words, increasing the labor force pushes inflation up, and decreasing the labor force leads to price deflation. The period of the COVID-19 pandemic is the first one when helicopter money flooded the US economy and the inflation effect observed in 2021 and 2022 is fully explained by the natural dollar devaluation related to money excess (see this post).

Introducing new data obtained in 2022, we depict in Figure 1 the effective FED rate, R, and the CPI inflation as expressed in the relative growth rate (1/year). In Figure 2, R is divided by a factor of 1.37 (see our previous post for details) to match the long-term trend in consumer price inflation. Before 1980, R was rather in the leading position. Since the late 1970s, R lags behind the CPI, i.e. inflation grows at its own rate and R just follows. The sought level of price inflation was flexible. The idea of interest rate adjustment is that a higher R should suppress price inflation. During deflationary periods with a slow economy, low (in some countries negative) R has to channel cheap money into economic growth. The reaction of inflation is also expected not shortly but with some time lag.

Figure 1. The CPI inflation rate and the Federal Reserve effective rate, R.

Figure 2. The CPI inflation rate (monthly y/y CPI inflation rate) and the Federal Reserve effective rate, R, divided by 1.37 (R/1.37).

The cumulative influence of the interest rate should produce a desired effect in the long run, and inflation should go in the direction of acceptable values or target inflation. Figure 3 displays the cumulative effect, i.e. the cumulative values of the monthly estimates of R/1.37 and CPI. This is an intriguing plot. In the long run, the cumulative R/1.37 curve fluctuates around the CPI one and returns to it. It is hard to believe that the sign of deviation of R/1.37 from the CPI curve affects the behaviour of the CPI, which is practically linear. Therefore, the efficiency of monetary policy is in doubt. The FRS has tried all means to return the CPI to R without any success and has to return R/1.37 to the CPI!


Figure 3. The cumulative monthly values of R/1.37 and CPI since 1955. Vertical lines show the documented recessions in the USA.

Figure 4 shows the difference between the two cumulative curves in Figure 3 – CPI-R/1.37. One can observe a periodic character of the difference and unreasonably high correlation of the recessions with the peaks and kicks in the difference curve. Currently, the difference is close to the peak value observed in 1980. The recession observed in 2020 is likely related to the COVID-19 socio-economic collapse.  With the current high inflation and low R, a recession in the new future seems to be a highly likely event. The FED lost control of inflation despite their long-term task being extremely easy – just retain R at the level of 1.37CPI.  


Figure 4. The difference between the cumulative R/1.37 and CPI. Notice the correlation of the peaks and kicks in the difference curve and the US recessions.  


We will present the labor force and inflation relation in the second part of this post.


9/14/22

Inflation in the USA - the pivot point to deflation

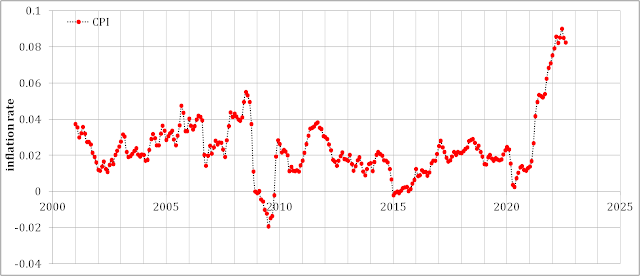
Inflation figures in the USA are frightening - 8.3%. At the same time, the rate of inflation has been slowly decreasing since June 2022. As was mentioned in this post published on June 3, the inflation in the USA is driven by the printed money pumped into the economy through Personal Income. In that sense, the price inflation has to be as transient as the injection of helicopter money. In other words, no printed money - no inflation a year later. Figure 1 depicts the link between helicopter money (as expressed by the excess of printed money in the Personal Income part of the nominal GDP). The helicopter money flows through the economy and affects the prices approximately one year after. The new injection of "counter-inflation" money will bring a bit more inflation in approximately 2024Q1. 

Figure 1. The current CPI (blue dots) delays by approximately 1.25 years behind the money injection. The shifted CPI (red dots) is synchronized with the money injection as expressed by the PI.  In the near future (likely in 2022Q4 or 2023Q1), the CPI will fall below the zero line.


Meanwhile, the price growth practically stopped and the CPI stalls at the level of 295 as Figure 2 shows. A year ago, the CPI was 273 and this gives the current inflation rate of 8.3% per year. Figure 1 shows that the rate of inflation has been falling since June 2022 as a reaction to the constant CPI since June 2022 and the growing CPI a year ago. The gap between the CPI values in 2022 and 2021 has been decreasing and the rate of inflation drops. 

Figure 2. CPI curve from 2015. Notice the shelf since June 2022. 

Figure 3 presents the monthly increment in the CPI and Figure 4 shows the corresponding rate of inflation. One can observe the coincidence of negative monthly CPI increments and deflation. The CPI growth stopped and the rate of inflation will be decreasing accordingly. Moreover, there is no reason for the CPI not to decrease after a dramatic growth period and the absence of printed money. The PI value is 2022Q3 will likely be at the long-term level with a high probability of a slight decrease as the trend observed in 2022 shows. The share of PI in GDP fell from 0.8753 in 2021Q4 to 0.8695 in 2022Q2. The GDP and PI estimates are quarterly and the next estimate will be published in October. The CPI data for September will be published earlier and there is no reason to think that the CPI inflation will not fall significantly.  

Figure 3. The monthly CPI increment. Notice the fall in the monthly increment in July and August. 
Figure 4. The inflation rate. Notice how the periods of deflation and low inflation coincide with the negative monthly CPI increment. 


8/14/22

Wind is dying in the UK

The split of the UK energy generation by sources in the Figure below demonstrates that wind is extremely low in hot weather related to anti-cyclon.  This makes the UK import a lot of electricity. 

I follow the UK electricity generation here (Energy Dashboard - real time and historical UK energy figures, analysis and mapping) and borrowed this Figure from this site. 


8/9/22

Европа - чистое зло?

 Министр иностранных дел Индии сказал в одном интервью, что Европа считает свои дела делами всего мира, а дела остального мира чужими делами. Европа, отказавшись от российского газа, так повысила цены на сжиженный газ, что бедные страны не могут его теперь купить. Европа перекупает, где может, газ с ранее чужих рынков и оставляет миллионы людей без отопления и электричества. Это приведет к большому количеству дополнительных заболеваний и смертей в странах Азии, Африки и Латинской Америки. Европа это чистое зло, основанное на нарциссизме и безразличии к чужим проблемам. Министр Джейшанкар был прав - Европе нет дела до остального мира.

7/31/22

США находятся в рецессии, но есть более серьезная долгосрочная проблема

Техническая рецессия в США официально объявляется двумя последовательными кварталами с отрицательным темпом роста. Новое определение рецессии было введено в начале 2000-х годов, чтобы объяснить рецессию, объявленную в 2001 году, первоначально основанную на темпах роста -1,3%, измеренных в этом году. При ревизии оценок ВВП (каждые 5 лет или около того) значение ВВП 2001 г. было переоценено до +0,8%, и рецессию 2001 г. пришлось бы отменить. Великие американские экономисты и бюрократы, ВАЭБ, дали новое определение рецессии, которое было крайне расплывчатым, но по существу основано на более широком взгляде на экономическую активность, например, на занятость и тому подобное. В результате 2001 год это год рецессии с положительным ростом реального ВВП (мне нравится этот оксюморон). Нынешнюю ситуацию с двумя последовательными кварталами экономического спада трудно оценить с точки зрения нового определения, и ВАЭБ использует неопределенность, указывая на низкий уровень безработицы. Это было бы правильной интерпретацией нового определения рецессии, искаженного из-за дела 2001 года. Однако есть два важных параметра, которые говорят о рабочей силе по-другому. Рисунок 1 демонстрирует эволюцию уровня участия в рабочей силе, LFPR, с 1948 года. Черная линия показывает годовые оценки Bureau of Labor Statistics, и видно, что LFPR упал с 67,1% в 1998 году до 61,7% в 2021 году. Это резкое падение. Население трудоспособного возраста (гражданское неинституциональное) в 2021 году составляло примерно 261 миллион человек. Разница в 5,4% дает более 14 млн человек вне состава рабочей силы по сравнению с LFPR 1998 года. Уровень безработицы в 3,6% исторически низкий, но он не может компенсировать падение LFPR. В 2001 году  доля безработных составляла около 5,5% рабочей силы. 

Красная линия является зеркальным отражением наблюдаемой кривой LFPR относительно 2000 года. Примерно 15 лет назад я упомянул, что волна Кондратьева находится на падающей ветви в США с 2000 года, и этот прогноз до сих пор отлично работает. Красная линия показывает, что это периодический процесс с периодом от 60 до 70 лет. LFPR США находится на падающей кривой до 59% примерно к 2030 году. Долгосрочное сокращение рабочей силы является реальной проблемой для экономики США. 

Соотношение занятости и численности населения, EPR, на рис. 2 еще более показательно. Периоды быстрого роста EPR в прошлом повторяются теперь как периоды резкого падения. Синхронизация потрясающая. EPR должен упасть до 55% примерно к 2030 году. Это будет болезненное падение для всей экономики. Нынешний всплеск иммиграции является хорошим ответом на вызовы — механический прирост населения США с 1980-х годов давал около 1,1% общего реального экономического роста. В 2000-х приток иммигрантов составлял всего 0,5–0,7%.

Рис 1. 

Рис 2


The US is in recession, but there is a bigger long term problem

Technical recession in the USA is formally announced by two subsequent quarters with a negative growth rate. A new recession definition was introduced at the beginning of the 2000s in order to cover the 2001 announced recession originally based on the -1.3% growth rate measured for this year. In the comprehensive GDP revision (every 5 years or so)  the 2001 GDP value was re-estimated to +0.8% and the recession had to be denounced. The Great American Economists and Bureaucrats gave a new recession definition which is vague but essentially is based on the broader view on economic health like employment and the like.  As a result, 2001 is a recession year with positive real GDP growth (I like this oxymoron). The current situation with two subsequent quarters of economic fall is hard to assess in terms of the new definition and the GAEB take an advantage of uncertainty indicating that the rate of unemployment is low. This would be a correct interpretation of the new recession definition perverted from the 2001 case. There are two important parameters however which tell a different story about the labor force. Figure 1 demonstrates the evolution of the labor force participation rate, LFPR, since 1948.  The black line shows the BLS annual estimates and one can see that the LFPR fell from 67.1% in 1998 to 61.7% in 2021. This is a dramatic fall. The working age population (civilian noninstitutional) in 2021 was approximately 261 million. the difference of 5.4% gives more than 14 million people out of the labor force compared to the 1998 LFPR. The 3.6% unemployment rate is historically low but it cannot compensate for the LFPR drop. It was around 5.5% in 2001.  

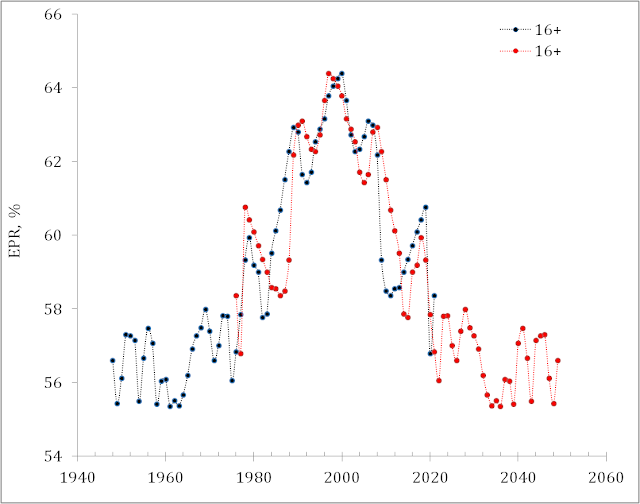
The red line is a mirror reflection of the observed LFPR curve relative to 2000. I mentioned approximately 15 years ago that the Kondratieff wave has had a falling branch in the US since 2000 and this prediction is still working excellent. The red line shows that this is a periodic process with a period of 60 to 70 years. The US LFPR is on a falling curve down to 59% around 2030.  The long-term labor force fall is the real challenge to the US economy.

The employment-population ratio, EPR,  in Figure 2 is even more illustrative. The periods of fast growth in the EPR are repeated as the periods of dramatic fall. The synchronization is amazing.  The EPR has to drop to 55% around 2030. This will be a painful fall for the whole economy.  The current surge in immigration is a good response to the challenges - the mechanical growth of the US population since the 1980s gave around 1.1% of the total real economic growth. In the 2000s, the immigration influx was only 0.5% to 0.7%. 


Figure 1. 

Figure 2


7/29/22

Каково будет число замерзших стариков в ЕС и Британии следующей зимой?

В Британии давно обнаружили, что зимой умирает гораздо больше стариков (например это статья в Guardian). Одна из причин - отсутствие денег на отопление. Для Британии это оказалось не проблемой - умирают, ну и пусть умирают. Это их личное дело. Интересно, такой же эффект отсутствия денег на отопление может быть в Германии и других европейских странах? Судя по ценам на отопление в Британии следующей весной найдут гораздо больше замерзших стариков. Пенсионные фонды будут довольны. Но число жертв санкций в ЕС и Британии превысит потери Украины в войне. Пока никто не думает о политических последствиях.

Now on arXiv.org "Effects of stochastic and natural seismic noise on the performance of waveform cross-correlation used to recover low-magnitude seismicity prior to the July 29, 2025, Kamchatka earthquake"

arXiv.org link :  [2607.16226] Effects of stochastic and natural seismic noise on the performance of waveform cross-correlation used to reco...