9/9/23

The U.S. will never get back to the (visible) prosperity of the 1950s

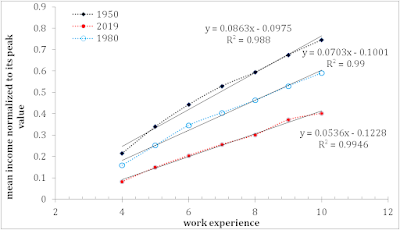
The 1950s and 1960s were the years of U.S. prosperity as many people think.  This was the middle-class era. People recall it with nostalgia. Let's take a look at the reasons behind the optimism of the 1950s. Figure 1 below shows the evolution of the mean income with age. The age bins for the mean income estimates are 1 year of work experience and the data are obtained from IPUMS.  We compare the years of 1950, 1990, and 2019. To compare data from different years we normalized all estimates to the peak mean income for a given year (Figure 2 displays the normalized mean income evolution in 1950, 1980, and 1990).  As a result, we observe in the figure the relative mean income growth with age experience (starting at the age of 16).

One can see that in 1950 people with 10 years of work experience had 75% of the peak income. In 1990, this share dropped below 60%. In 2019, the mean income with 10 years of work experience was just above half of that in 1950 - 40%. Therefore, the rate of income growth has a long-term decline in the younger age group where people create families and raise children. It was easy in the 1950s and 1960s. And it is almost impossible in the 2020s for a majority of the U.S. population. Unfortunately, the peak age for the mean income increases as a square root of the real GDP per capita. The future of U.S. society is defined by income growth - the chance for young people to create families and raise children will diminish with real economic growth. The visible prosperity of the 1950s will never return. 

Figure 1. The normalized mean income evolution for young people.

Figure 2. The normalized mean income evolution 


9/8/23

Wind is fading away in the UK. Will the natural gas price grow?

There exists an important source of information on the energy production in the US with the detailed spit into sources: Energy Dashboard - real time and historical GB electricity data, carbon emissions and UK generation sites mapping

The data shown below cover different periods of time from 7 days to 90 days. The (natural) gas price crisis in 2021 started with the low wind energy production in the UK. The last two weeks are characterized by very low wind energy production and significant growth in gas energy production in the UK.


Lenght         Gas, %     Wind,%    Imports, %

7 days          43             12.1          11.8

14 days       42.8           12.7          11.2                   

30 days      38.8            22.2          10.7

90 days      34.8            23.7          12.1 


9/5/23

Distinguishing the aftershock sequences of the DPRK5 and DPRK6 underground nuclear tests

 The seismic (likely aftershock) activity within the DPRK site has been increasing since May 2023. This is a very unusual observation and the paper from 2021 regains its importance. I am going to write a new paper on the current seismic activity which is hard to explain by natural processes.


AbstractThe rate of aftershocks in the sequence initiated by the DPRK underground tests has been increasing since January 2021. In total, 22 reliable aftershocks were detected between January 13 and October 1, 2021. Their characteristics are similar to the aftershocks in one of two clusters: 1) the fifth DPRK (DPRK5) test (mb(IDC)=5.09) conducted on September 9, 2016, which induced the first DPRK aftershock in the sequence detected at 1:50:48 UTC on September 11, 2016; 2) the sixth DPRK (DPRK6) explosion (mb(IDC)=6.07), which generates its aftershock sequence with characteristics significantly different from the aftershocks in the DPRK5 sequence. The length, intensity, and alternating character of these sequences suggest specific mechanisms of energy release likely associated with the interaction of the damaged zones of the DPRK5 and DPRK6 and the collapse of their cavities with progressive propagation of the collapsing chimneys to the free surface. According to the depth estimates based on the moment tensor modelling, the DPRK5 and DPRK6 were conducted at practically the same depths. The difference in magnitudes suggests that their damaged zones differ by a factor of 2 or more. The first aftershock of the DPRK6 (mb(IDC=4.12) 8.5 minutes after the test is evidence of the cavity collapse and creation of a chimney, which did not reach the surface. The activity in 2021 indicates that the chimney collapse is not finished yet. One can expect more aftershocks in the near future, likely ended with the chimney reaching the free surface. 

Gender income disparity in the USA

 This paper "Gender income disparity in the USA: analysis and dynamic modelling" is also of interest


Abstract

We analyze and develop a quantitative model describing the evolution of personal income distribution (PID) for males and females in the U.S. between 1930 and 2014. The overall microeconomic model, which we introduced ten years ago, accurately predicts the change in mean income as a function of age as well as the dependence on age of the portion of people distributed according to the Pareto law. As a result, we have precisely described the change in the Gini ratio since the start of income measurements in 1947. The overall population consists of two genders, however, which have different income distributions. The difference between incomes earned by male and female populations has been experiencing dramatic changes over time. Here, we model the internal dynamics of men’s and women’s PIDs separately and then describe their relative contribution to the overall PID. Our original model is refined to match all principal gender-dependent observations. We found that women in the U.S. are deprived of higher job positions (work capital). This is the cause of the long-term income inequality between males and females in the U.S. It is unjust to women and has a negative effect on real economic growth. Women have been catching up since the 1960s and that improves the performance of the U.S. economy. It will take decades, however, to full income equality between genders. There are no new defining parameters included in the model except the critical age when people start to lose their incomes, which was split into two critical ages for low-middle incomes and the highest incomes, which obey a power law distribution. Such an extension becomes necessary in order to match the observation that the female population in the earlier 1960s was practically not represented in the highest incomes. In the overall model, the male population dominates in the top income range and the difference between two critical ages is masked. Gender versions of the refined model provide consistent quantitative descriptions of the principal features in the male and female income distribution.

Race and gender income inequality in the USA: black women vs. white men

Almost every day, I have a request to publish this paper "Race and gender income inequality in the USA: black women vs. white men" in medical and social journals. Do not understand the reason for such an interest.  


Abstract

Income inequality between different races in the U.S. is especially large. This difference is even larger when gender is involved. In a complementary study, we have developed a dynamic microeconomic model accurately describing the evolution of male and female incomes since 1930. Here, we extend our analysis and model the disparity between the black and white population in the U.S., separately for males and females. Unfortunately, income microdata provided by the U.S. Census Bureau for other races and ethnic groups is not time-compatible or too short for modeling purposes. We are forced to constrain our analysis to the black and white population, but all principal results can be extrapolated to other races and ethnicities. Our analysis shows that black females and white males are two poles of the overall income inequality. The prediction of income distribution for two extreme cases with one model is the main challenge of this study.

9/3/23

How linear growth in real GDP per capita rips the world up

I wrote a paper "Real GDP per capita: global redistribution of economic power" in 2020 (available on arxiv.org) explaining the increasing frequency and atrocity of collisions between developed and developing countries. This is the final paragraph. 

"Finally, in the world of the rapid growth of the future economic behemoths and stagnation of the most developed countries conflicts are inevitable. Unfair trade restrictions, political pressure, media attacks, propaganda, military aggression, and other dimensions of these conflicts may only rise in amplitude and extent. These conflicts involve new countries in the global clash, which also includes the clash of civilizations as an additional dimension. This is only because the growth in real GDP per capita is a linear function of time. In the exponential economic world, the lead of developed countries would be eternal as they had better start conditions and the exponent provides the increasing economic gap. In the linear economic world, the lead in GDPpc is constant, the chasing countries grow faster and the gap is shrinking in relative terms."

9/2/23

BRICS makes peace

The BRICS old members, new members, and aspirants use BRICS to negotiate for peace. For example, India and Chine, Saudi Arabia and Iran. The main idea of BRICS is mutual prosperity: demand meets supply (oil, gas, metals, rare earths, grain, ...). G7 promotes conflicts. Divide and rule. Say “NO” to war promoters!