Technical recession in the USA is formally announced by two subsequent quarters with a negative growth rate. A new recession definition was introduced at the beginning of the 2000s in order to cover the 2001 announced recession originally based on the -1.3% growth rate measured for this year. In the comprehensive GDP revision (every 5 years or so) the 2001 GDP value was re-estimated to +0.8% and the recession had to be denounced. The Great American Economists and Bureaucrats gave a new recession definition which is vague but essentially is based on the broader view on economic health like employment and the like. As a result, 2001 is a recession year with positive real GDP growth (I like this oxymoron). The current situation with two subsequent quarters of economic fall is hard to assess in terms of the new definition and the GAEB take an advantage of uncertainty indicating that the rate of unemployment is low. This would be a correct interpretation of the new recession definition perverted from the 2001 case. There are two important parameters however which tell a different story about the labor force. Figure 1 demonstrates the evolution of the labor force participation rate, LFPR, since 1948. The black line shows the BLS annual estimates and one can see that the LFPR fell from 67.1% in 1998 to 61.7% in 2021. This is a dramatic fall. The working age population (civilian noninstitutional) in 2021 was approximately 261 million. the difference of 5.4% gives more than 14 million people out of the labor force compared to the 1998 LFPR. The 3.6% unemployment rate is historically low but it cannot compensate for the LFPR drop. It was around 5.5% in 2001.
The red line is a mirror reflection of the observed LFPR curve relative to 2000. I mentioned approximately 15 years ago that the Kondratieff wave has had a falling branch in the US since 2000 and this prediction is still working excellent. The red line shows that this is a periodic process with a period of 60 to 70 years. The US LFPR is on a falling curve down to 59% around 2030. The long-term labor force fall is the real challenge to the US economy.
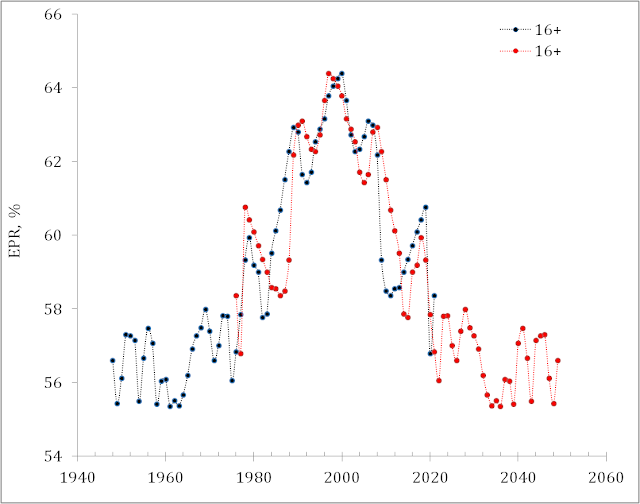
The employment-population ratio, EPR, in Figure 2 is even more illustrative. The periods of fast growth in the EPR are repeated as the periods of dramatic fall. The synchronization is amazing. The EPR has to drop to 55% around 2030. This will be a painful fall for the whole economy. The current surge in immigration is a good response to the challenges - the mechanical growth of the US population since the 1980s gave around 1.1% of the total real economic growth. In the 2000s, the immigration influx was only 0.5% to 0.7%.


No comments:
Post a Comment