The price inflation rate in the USA is still frightening in October 2022 - 7.7%, but there is a predicted improvement from the peak of 9.1% in June 2022. As was mentioned in these posts published on June 3 and September 14, the inflation in the USA is driven by the printed money pumped into the economy through Personal Income. In that sense, the price inflation has to be as transient as the injection of “helicopter money”. In other words, no printed money - no inflation a year later. Figure 1 depicts the link between the helicopter money (as expressed by the excess of printed money in the Personal Income part of the nominal GDP). The helicopter money flows through the economy and affects the prices approximately one year later. The new injection of "counter-inflation" money will bring a bit more inflation in approximately 2024Q1.
Currently, the PI/GDP ratio sinks
below the long-term threshold of 87% and goes deeper and deeper forcing consumer
prices also to fall. The CPI will drop together with the PI share in the near
future. The helicopter money is digested by the US economy and fully
transferred into consumer prices.
Figure 1. The current CPI (blue dots)
delays by approximately 1.25 years behind the money injection. The shifted CPI
(red dots) is synchronized with the money injection as expressed by the
PI. In the near future (likely in 2023Q1-2), the CPI will fall below the
zero line.
The segment with fast consumer price
growth ended in June 2022, and the CPI has been slowly increasing above the
level of 295 as Figure 2 shows. In October 2021, the CPI was 276.59 and this
gives the current inflation rate of 7.76% per year, with the CPI=298.06 in
October 2022. Figure 1 shows that the rate of inflation has been falling since
June 2022 as a reaction to the slowly growing CPI since June 2022 and the quickly
growing CPI a year ago. The gap between the CPI values in 2022 and 2021 has
been decreasing and the rate of inflation drops.
Figure 2. CPI curve from 2015.
Figure 3 presents the monthly increment in the CPI and Figure 4 shows
the corresponding rate of inflation. One can observe the synchronization of
negative monthly CPI increments and deflation. The CPI growth stopped and the
rate of inflation will be decreasing accordingly. Moreover, there is no reason
for the CPI not to decrease after a dramatic growth period and the absence of
printed money and the corresponding PI/GDP ratio decline. The PI/GDP ratio in 2023Q1
will likely be much below the long-term level. The share of PI in GDP fell from
0.8753 in 2021Q4 to 0.854 in 2022Q3. The GDP and PI estimates are quarterly and
the next estimate will be published in January 2023. The CPI data for November
2022 will be published in December and there is no reason to think that the CPI
inflation will not fall by a larger value than in October 2022 (-0.5% from
September).
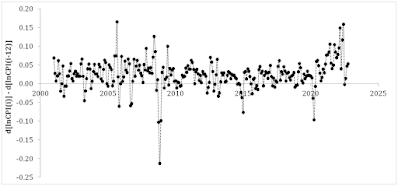
Figure 5 presents the monthly (annualized) CPI inflation rate. In October 2022, this rate was +0.5%. However, in October 2021, the monthly rate was +1.0%. The difference in growth rates is -0.5% between 2022 and 2021. This is an indication of inflation fall and Figure 6 presents the difference between the current CPI monthly growth rate and a year ago. This difference is negative since July 2022. It will be negative for the next year or so with the potential decrease of the inflation rate into the negative zone.
Figure 3. The monthly CPI increment. Notice the
fall in the monthly increment in July and October.
Figure 5. The monthly (annualized) CPI inflation rate.
Figure 6. The difference between the monthly CPI inflation rate for a given month
and the same month a year ago. Notice the negative difference since July 2022. The
deflation is coming with the


No comments:
Post a Comment