НАТО разрушила много городов и населенных пунктов и убила миллионы людей по всему миру в 21-м веке (и еще больше в 20-м веке). Есть много стран и людей, разгневанных и готовых сражаться с НАТО, если только можно создать равные условия. Украина привлекает много солдат и граждан из стран НАТО (и присоединившихся к ней). Как только в мире придут к выводу, что на Украине воюет НАТО (доля экс натовских солдат и наемников процентов 30-40%) и Россия, добровольцы и некоторые страны создадут анти-натовскую коалиции и приедут мстить. Они получат все необходимое оборудование и возможности мести. И это не будет борьба против Украины, а только против НАТО (Запада). Линии снабжения НАТО не выдержат.
2/5/23


2/4/23
Russian plan is simple - involve as many NATO soldiers in Ukraine as possible and create an anti-NATO coalition to annihilate them.
NATO has done a lot of destruction and killed millions of people in the world in the 21st century (and more in the 20s century). There are many countries and people angry and ready to fight against NATO in an equal fight. Ukraine attracts a lot of soldiers and citizens from NATO (and affiliated) countries. Volunteers from the anti-NATO coalition will come to get revenge and will be given all the needed equipment and opportunities. And this will not be a fight against Ukraine or NATO (the West).
Personal income inequality has been increasing in the USA since 2010
Personal income is the American dream - the measure of success. The success histories have been fading away together with the dream - more and more people moving toward the bottom of the personal income distribution. Figure 1 shows the Gini ratio which is the most famous integral measure of income inequality. This graph is retrieved from the CPS data sets published by the US Census Bureau. One important notice on this graph is that the Gini ratio in the Census Bureau definition does not include people not reporting any income during the previous year during the (March) Annual Social and Economic Supplement of the Current Population Survey (ASEC CPS). In 2021, there were 268,723,000 people 16+ and only 237,500,000 of them reported income (~12%). This contradicts the most comprehensive definition of the Gini ratio as related to the whole society. (The income inequality in the USA would be too large if the non-incomers are counted in.) Even with people with incomes, the Gini ratio is extremely large in 2021 - 0.527. This is especially weird if to take into account the helicopter money injected in 2020 and 2021. In 2007, the Gini ratio was 0.494.

Figure 1. The Gini ratio for the population of 16 and above in the USA.
Figure 2 presents the evolution of the Gini ratio in 10-year-wide age groups. The increase in the Gini is observed in all age groups.

Figure 2. Gini ratio in 10-year age groups. For example, 30 is the age group from 25 to 34.
The current trend in income inequality might be related to the significant drop in the Share of Labour Compensation in GDP at Current National Prices for United States in Figure 3 and the significant fall in the labor force participation rate in Figure 4.
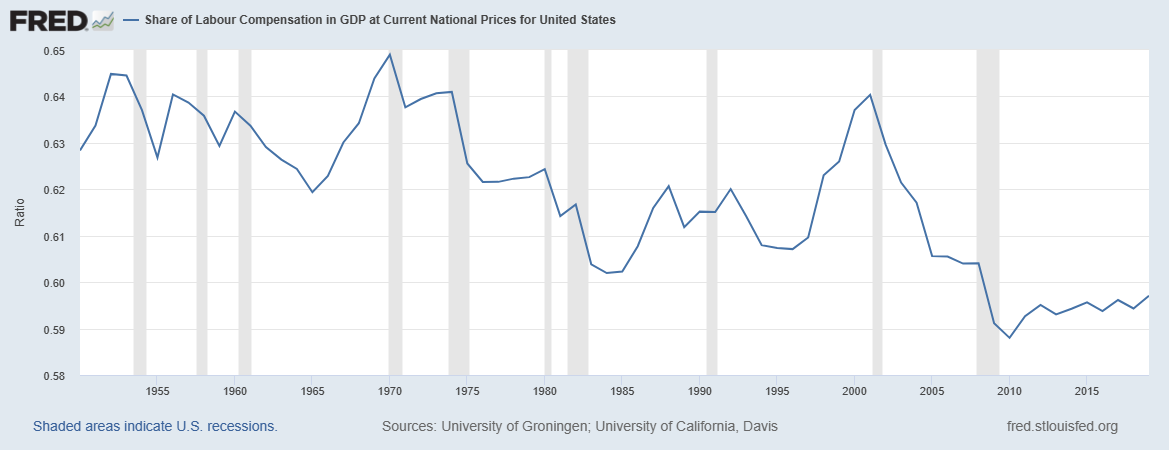
Figure 3. FRED data on the share of labour compensation in the GDP

Figure 4. Civilian labour force participation rate (BLS data)
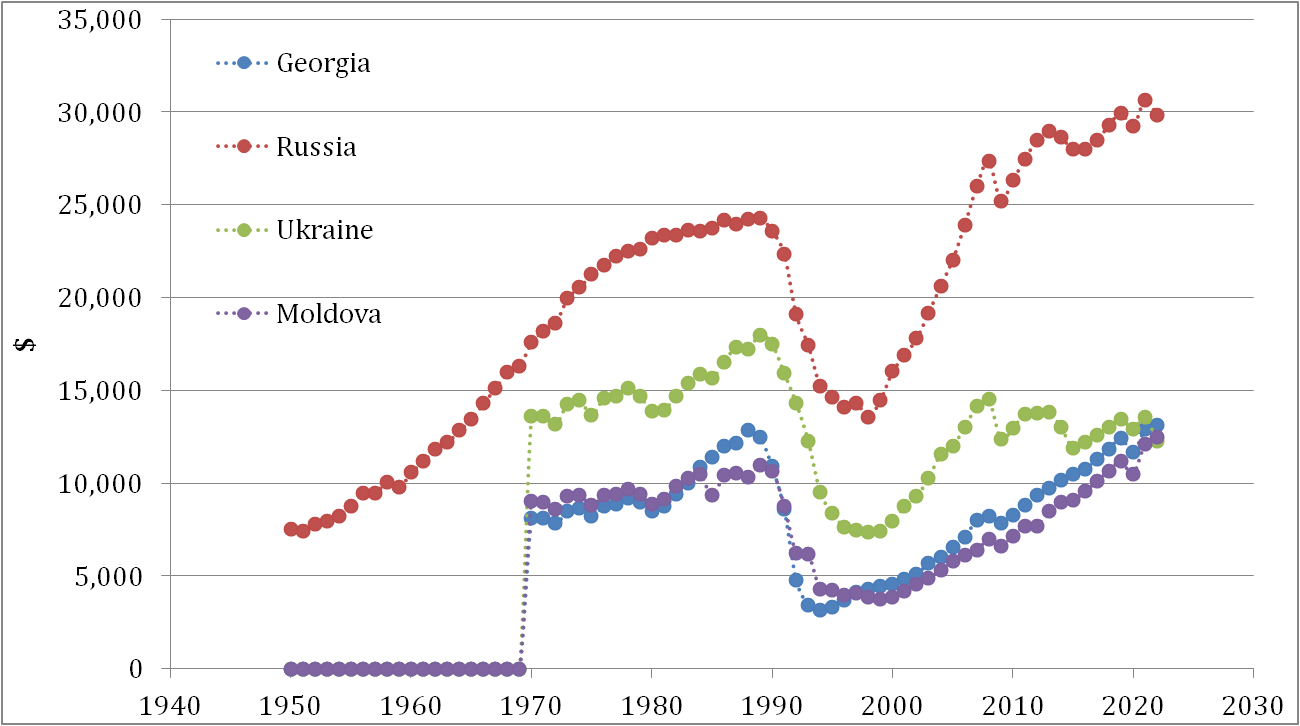
Real GDP per capita: Ukraine, Georgia, and Moldova. Ukraine below the 1970 level - lost half-century.
The real GDP per capita is a good measure of the country's prosperity and the shape of the economy. It also may indicate the direction of future evolution. The figure below is borrowed from "The Conference Board Total Economy Database™ - Output, Labor and Labor Productivity, 1950-2022. April 2022." This might be not the most reliable source of data, but all other sources give similar results.
Ukraine is a failed economy with a current GDP per capita level below that in 1970. The lost half-century. Georgia and Moldova overcame the 1970s in the 2010s, but are still at the level of 1988.
2/2/23
The excess personal income from the helicopter money is equal to the total growth in consumer prices from 2020 to 2022
In our previous post, we presented arguments in favor of a long deflationary period in the USA starting in 2023. There was one estimate to be clarified in order to better understand the connection between the total gain in the consumer price index in 2020 and 2021 and the helicopter money injected into the US economy during the same period. As we estimated, the CPI increased from approximately ~260 in 2020 (before the start of the inflation growth period) to ~295 in 2022 (before the end of the inflationary period). A crude estimate of the total price increase during the inflationary period gives 15%. In 2021, fifteen percent of the nominal GDP makes approximately 3 trillion US dollars. The amount of helicopter money injected into the US economy between 2020Q2 and 2021Q3 can be estimated as the excess of personal income, PI, during the same period relative to the average PI share between 2012 and 2019 which is 86%. The helicopter money excess is 2.9 trillion. This money is likely the source of price inflation, and the most likely the only source of inflation.
Subscribe to:
Posts (Atom)
-
 These are two biggest parts of the Former Soviet Union. To characterize them from the economic point of view we borrow data from the Tot...
 -
These days sanctions and retaliation is a hot topic. The first round is over and we will likely observe escalation well supported by po...
-
 Yesterday I missed the absolute hero of deflation in the US – the consumer price index of information technology, hardware and software (see...