12/7/22

A significant drop in the annual CPI inflation rate is expected in the USA

The annual CPI inflation rate is defined by the total change in the Consumer Price Index and the CPI value one year ago. With growing CPI, a constant annual change in the CPI produces decreasing inflation rate due to the increasing denominator. The jump in the CPI ( see Figure 1) from August 2021 to May 2022  produced a dramatic surge in the inflation rate (Figure 2). The inflation increase in the first quarter of 2021 was related to the drop in the CPI and the corresponding fall in the inflation rate denominator in the first quarter of 2021.

Figure 1. The CPI in the USA between January 2015 and October 2022. 

Figure 2. CPI inflation rate in the USA

As we mentioned in our previous posts (here and here), the CPI evolution during the COVID-19 pandemic is driven by printed ("helicopter") money - several trillions of dollars poured into the US economy in 2020 and 2021. The consumer prices just accommodated the money in a price level increase. The lag behind the money insert and the CPi reaction is approximately one year and Figure 3 repeats the same picture in the previous post from Nov 13.  In Figure 3, one can see that the monthly CPI inflation rate for Nov 2022 should drop and the annual inflation rate has to fall as well. 

Figure 3. The current CPI (blue dots) was delayed by approximately 1.25 years behind the money injection. The shifted CPI (red dots) is synchronized with the money injection as expressed by the Personal Income.  In the near future (likely in 2023Q1-2), the CPI will fall below the zero line.

Figure 4 presents the difference in the CPI annualized inflation rates: current and 12 months ago. This difference indicates the trend in the CPI inflation evolution. The negative values mean that the CPI inflation falls as was observed between July and October 2022. The estimate for November 2022 will be released by the BLS on Dec 13. The trend in Figure 4 indicates that the CPI inflation will drop below 7% and this means that the FOMC will retain the overnight rate rather than increase it by 0.75 percentage points. The trend will extend into 2023 as all printed money is fully accommodated by the CPI and there is no pressure left to inflate the babble. In 2023, deflation is coming as the Personal Income falls below its long-term average.   

Figure 4. The difference in the CPI annualized inflation rates: current and 12 months ago.


12/2/22

Grim labor statistics in the USA

Despite the increase of 263,000 in total nonfarm payroll employment in November, the seasonally adjusted household labor estimation are all negative. 

The total civilian noninstitutional population increased by 173,00 from 264,535,000 to 264,708,000, but the civilian labor force fell by 186,000 from 164,667,000 to 164,481,000.  The number of employed also fell from 158,608,000 to 158,470,00 (-138,000).  The employment/population ratio also fell by 0.1% from 60.0% to 59.9% (60.1% in September). The labor force participation rate decreased by 0.1% from 62.2% to 62.1%  (62.3% in September 2022, and 61. 9% in November 2021. Finally, the population 'not in the labor force' increased from 99,868,000 to 100,227,000 (+359,000). 

The long-term decrease in the most important labor characteristics continues. This is insane to say that the unemployment rate is lower than in April 2000 when the labor force participation rate fell from 67.3%  in April 2000 to 62.1% in November 2022. This is 5.1% of the current civilian noninstitutional population or ~13,000,000. Currently, the number of unemployed is ~6,000,000. 

12/1/22

"Старинные психопаты" Н.С.Лескова и Эпштейн/Максвелл

Рассказ Лескова "Старинные психопаты" тяжело читать и остается чувство безотчетной темной тревоги. История эта случилась очень давно. 

Сегодня перечитал начало и понял его по-новому.

"Степан Иванович был атлет и богатырь, а притом также хлебосол, самодур и преужасный развратник, но имел образование. Он был одним из тех молодых людей, которых императрица Екатерина посылала в Англию «для просвещения ума и сердца».

По возвращении из Англии он поступил на службу в конногвардейский полк, но как только дослужился до чина поручика — вышел в отставку, женился на тверской дворянке, девице Степаниде Васильевне из рода Шубинских, и поселился в Москве в собственном доме.

Делать Вишневскому здесь было нечего, и он начал «чудить».

Прежде всего он надумал импонировать москвичам своей хохлацкой «нацыей». Он не хотел никого знать — одевался по-хохлацки, много пил «запридуху» и ел, будто, одно только медвежье мясо." 

Поведение пары Эпштейн/Максвелл и связанных с ним персонажей повторяет историю Лескова в ужасных подробностях. 

11/30/22

Джейми Ши НАТО инструктировал Россию по разрушению энергетической системы Украины в 1999 г.

 25 мая 1999 г.

Вопрос (Норвежское информационное агентство): Прошу прощения, Джейми, но если вы говорите, что в армии много резервных генераторов, то почему вы лишаете 70% страны не только электричества, но и водоснабжения, если у него так много резервного электричества, которое он может использовать, потому что вы говорите, что нацелены только на военные цели? Джейми Ши: Да, боюсь, электричество также приводит в действие системы управления и контроля. Если президент Милошевич действительно хочет, чтобы все его население имело воду и электричество, все, что ему нужно сделать, это принять пять условий НАТО, и мы остановим эту кампанию. Но пока он этого не сделает, мы будем продолжать атаковать те цели, которые обеспечивают электричеством его вооруженные силы. Если это имеет гражданские последствия, то это его дело, но эта вода, это электричество снова включается для народа Сербии.

In 1999, NATO instructed Russia why destroying electric grid is crucial

May 25, 1999 

Question (Norwegian News Agency): I am sorry Jamie but if you say that the Army has a lot of back-up generators, why are you depriving 70% of the country of not only electricity, but also water supply, if he has so much back-up electricity that he can use because you say you are only targeting military targets?

Jamie Shea : Yes, I'm afraid electricity also drives command and control systems. If President Milosevic really wants all of his population to have water and electricity all he has to do is accept NATO's five conditions and we will stop this campaign. But as long as he doesn't do so we will continue to attack those targets which provide the electricity for his armed forces. If that has civilian consequences, it's for him to deal with but that water, that electricity is turned back on for the people of Serbia. 


11/28/22

COVID-19 excess death comparison: Austria vs. Sweden

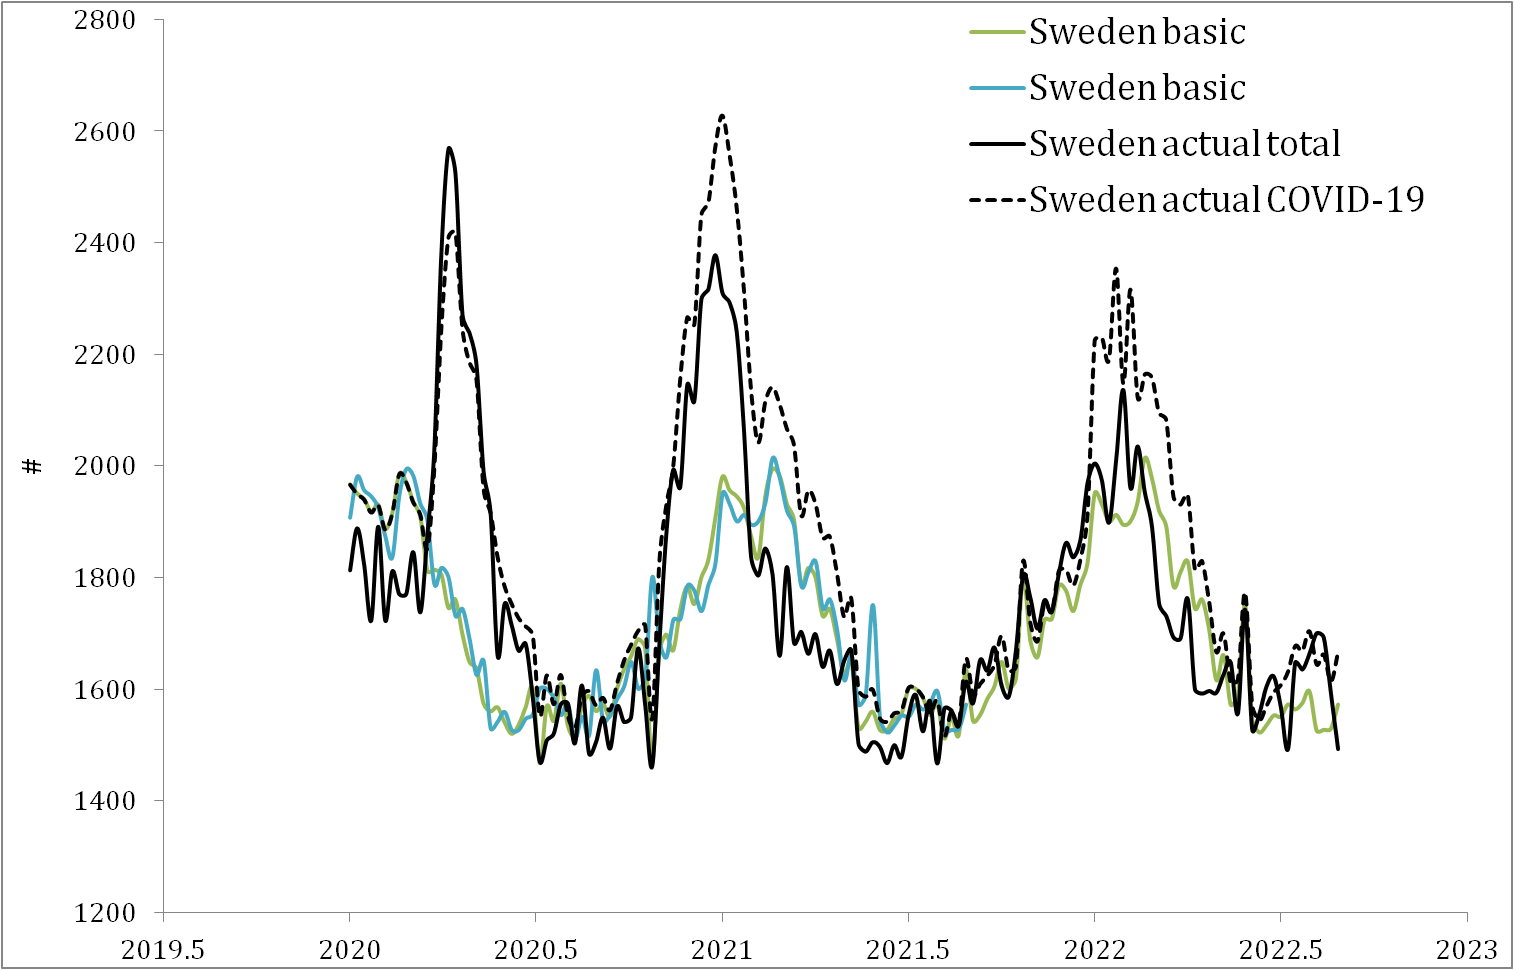
We continue comparing the data from OECD.Stat reporting weekly mortality numbers and rates for the pandemic period. The corresponding sets of data for individual countries can be used to compare the outcome of various anti-pandemic strategies. In this post, we compare Austria and Sweden. The COVID-19-related estimates are presented in two different ways: the absolute number of the deviation from the long-term weekly averages and the corresponding rates (% change from average). There are two parameters: total mortality values for all causes and those related to COVID-19 (definitions of COVID-19-related cases are likely to vary between the OECD countries). Figure 1 shows the total and COVID-19-related numbers and rates. One can easily obtain the average numbers from the total rates and deviations from the average values themselves. Figure 2 shows the long-term average weekly numbers, the total weekly numbers, and the COVID-19-related weekly numbers for Sweden. As a check of the basic average (seasonally adjusted) values we have calculated the total weakly death numbers for each week between 2020 and the last estimate in 2022 as shown in Figure 2 by the green curve. Then we shifted this curve 53 months (2020 is the leap year) back (the blue line) and compared the average values for the same week with a one-year shift. One can see that the average values are all pre-pandemic and this makes it possible to get unbiased estimates of the COVID-19 effect on excess mortality. 

Figure 1. Total and COVID-19-related numbers (upper panel) and rates (lower panel). From the total rates and deviations from the average values,

Figure 2. OECD statistics for Sweden between 2020 and 2022. The total numbers are shown.

 In Austria, the COVID-19-related curve is almost always below the total curve, but there are some segments where the COVID-19 curve is above the total curve. The highest mortality was observed at the fourth quarter of 2020 and this peak is fully related to COVID-19. At the beginning of 2021 as well as at the beginning of 2022, the COVID-19 curve is above the total curve. In Sweden, the first and almost the highest peak in 2020 was the only one not related to the (fall-winter) seasonal increase but is rather the outcome of the no-lockdown policy.

The relative (% change from average) values in Figure 1 are can be used for a cross-country comparison.  One can see that only one peak in the second half of 2020 in the lower panel in Figure 1 is synchronized in both countries, with the peak in Austria is the largest observed during the pandemic. We have calculated the rates in Figure 1 using the same average estimates for the total and COVID-19 cases as presented in Figure 2.  The total deviation from the average values in Sweden was negative during relatively long periods of time while COVID-19-related deviation numbers are almost always positive. The average curve and the shifted average curve almost coincide with the accuracy of calculations using the OECD data with just one decimal digit. The % change from the average in Sweden draws an interesting picture: the total mortality rate drops below the average in the pandemic conditions. The COVID-19-related rate is positive. This rate has to be non-negative because there can be no negative deviations in the number of COVID-19-related cases. The total numbers include all causes and thus the deviation in non-COVID-19 cases can be a large negative number since these reasons are behind the average curve itself. 

Overall, the OECD data for Sweden shows that the COVID-19 pandemic was severe for the country and the excess death rate is high mainly because of the virus itself. At the same time, the pandemic suppressed the severity of all other illnesses (or due to the biased statistics for the normalized death causes) taken together and the total death rates fell below the long-term averages despite the pandemic. The driving forces behind such an outstanding finding are not clear and need deeper investigation of various death causes and corresponding definitions.

The dynamic parameters in Figure 1 do not present the long-term trends in the efficiency of the specific anti-COVID-19 policies during the pandemic. Figure 3 presents the integral behaviour in the total excess deaths and those related to COVID-19. The total curves are the ratio of the running sum of all excess deaths and the corresponding sum of all average death numbers from week 12 of 2020. The COVID-19 curves are the ratio of the running sum of the COVID-19 numbers and the corresponding sum of all death numbers from week 12 of 2020 (see Figure 4 for corresponding running sums for Austria). Figure 3 shows that Sweden has chosen a better long-term approach that guarantees lower total life losses over the pandemic period. In August 2022, the integral excess death rate during the pandemic was 11% in Austria and less than 4% in Sweden. At the same time, the COVID-19 results are closer for both countries. The advantage of Sweden is not in the treatment of COVID-19 as such but in the reduction of other health risks.  (One can also suggest that Austria and Sweden define COVID-19 deaths differently.)  
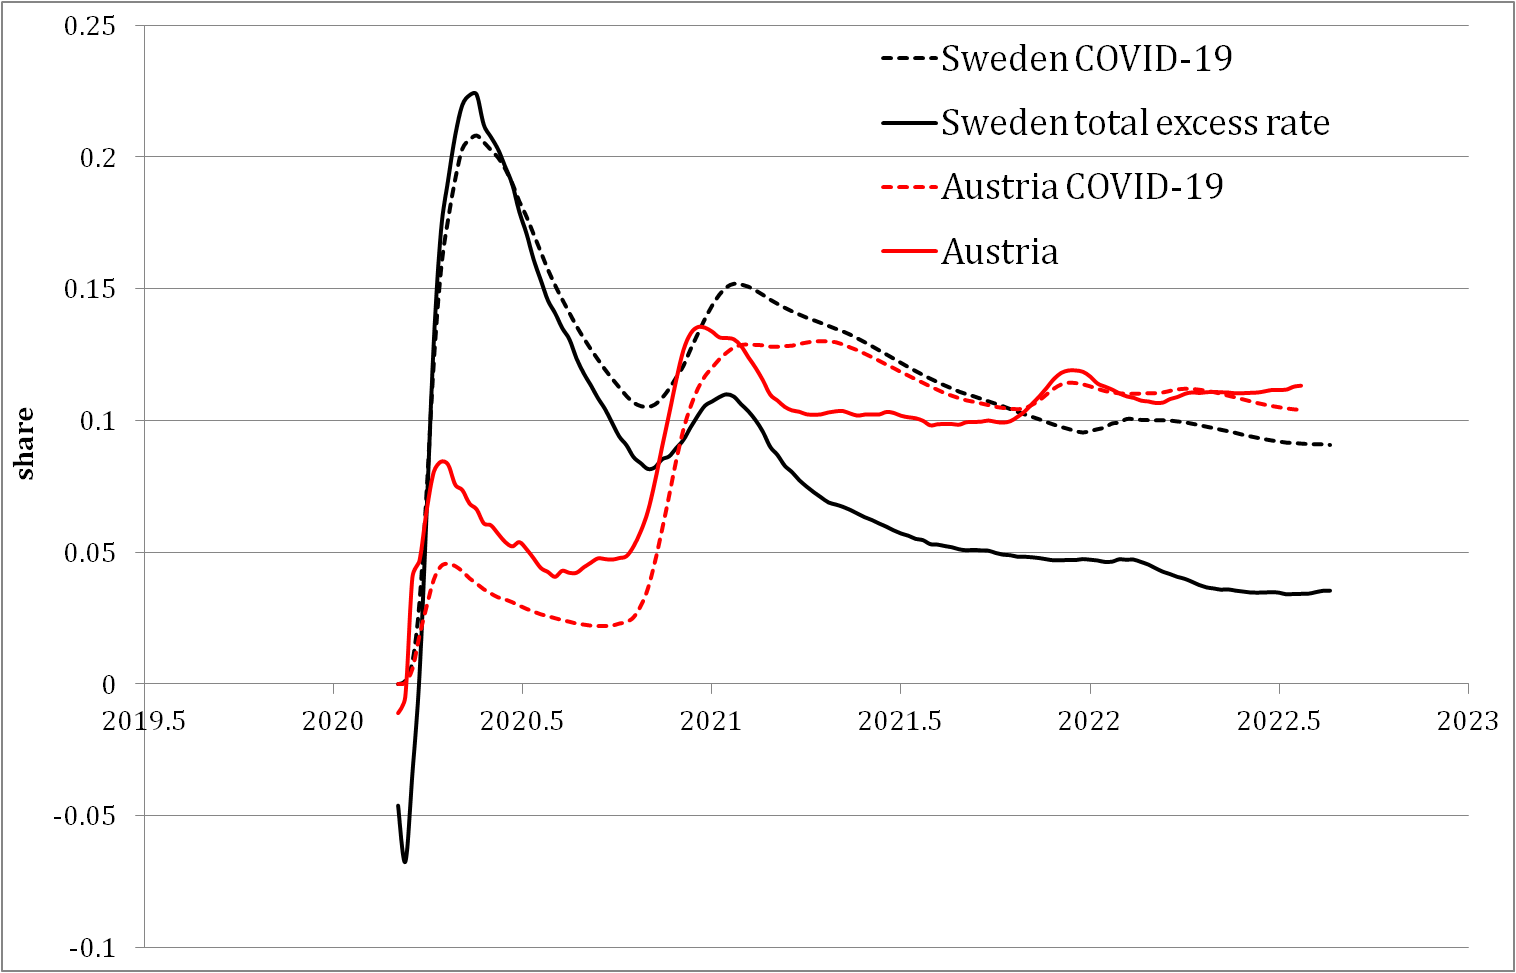
 

Figure 3. Integral total excess death rate and COVID-19-related since week 12, 2020.

Figure 4. Austria. The running sums: 1) the average weekly death numbers; 2) the total weekly deviations; 3) the COVID-19-related weekly deviations. 

11/27/22

Холод увеличит смертность в ЕС больше, чем конфликт на Украине


Холод увеличит смертность в ЕС больше, чем конфликт на Украине

  • Холод увеличит смертность в ЕС больше, чем конфликт на Украине
  • Холод увеличит смертность в ЕС больше, чем конфликт на Украине
  • Холод увеличит смертность в ЕС больше, чем конфликт на Украине
  • Холод увеличит смертность в ЕС больше, чем конфликт на Украине
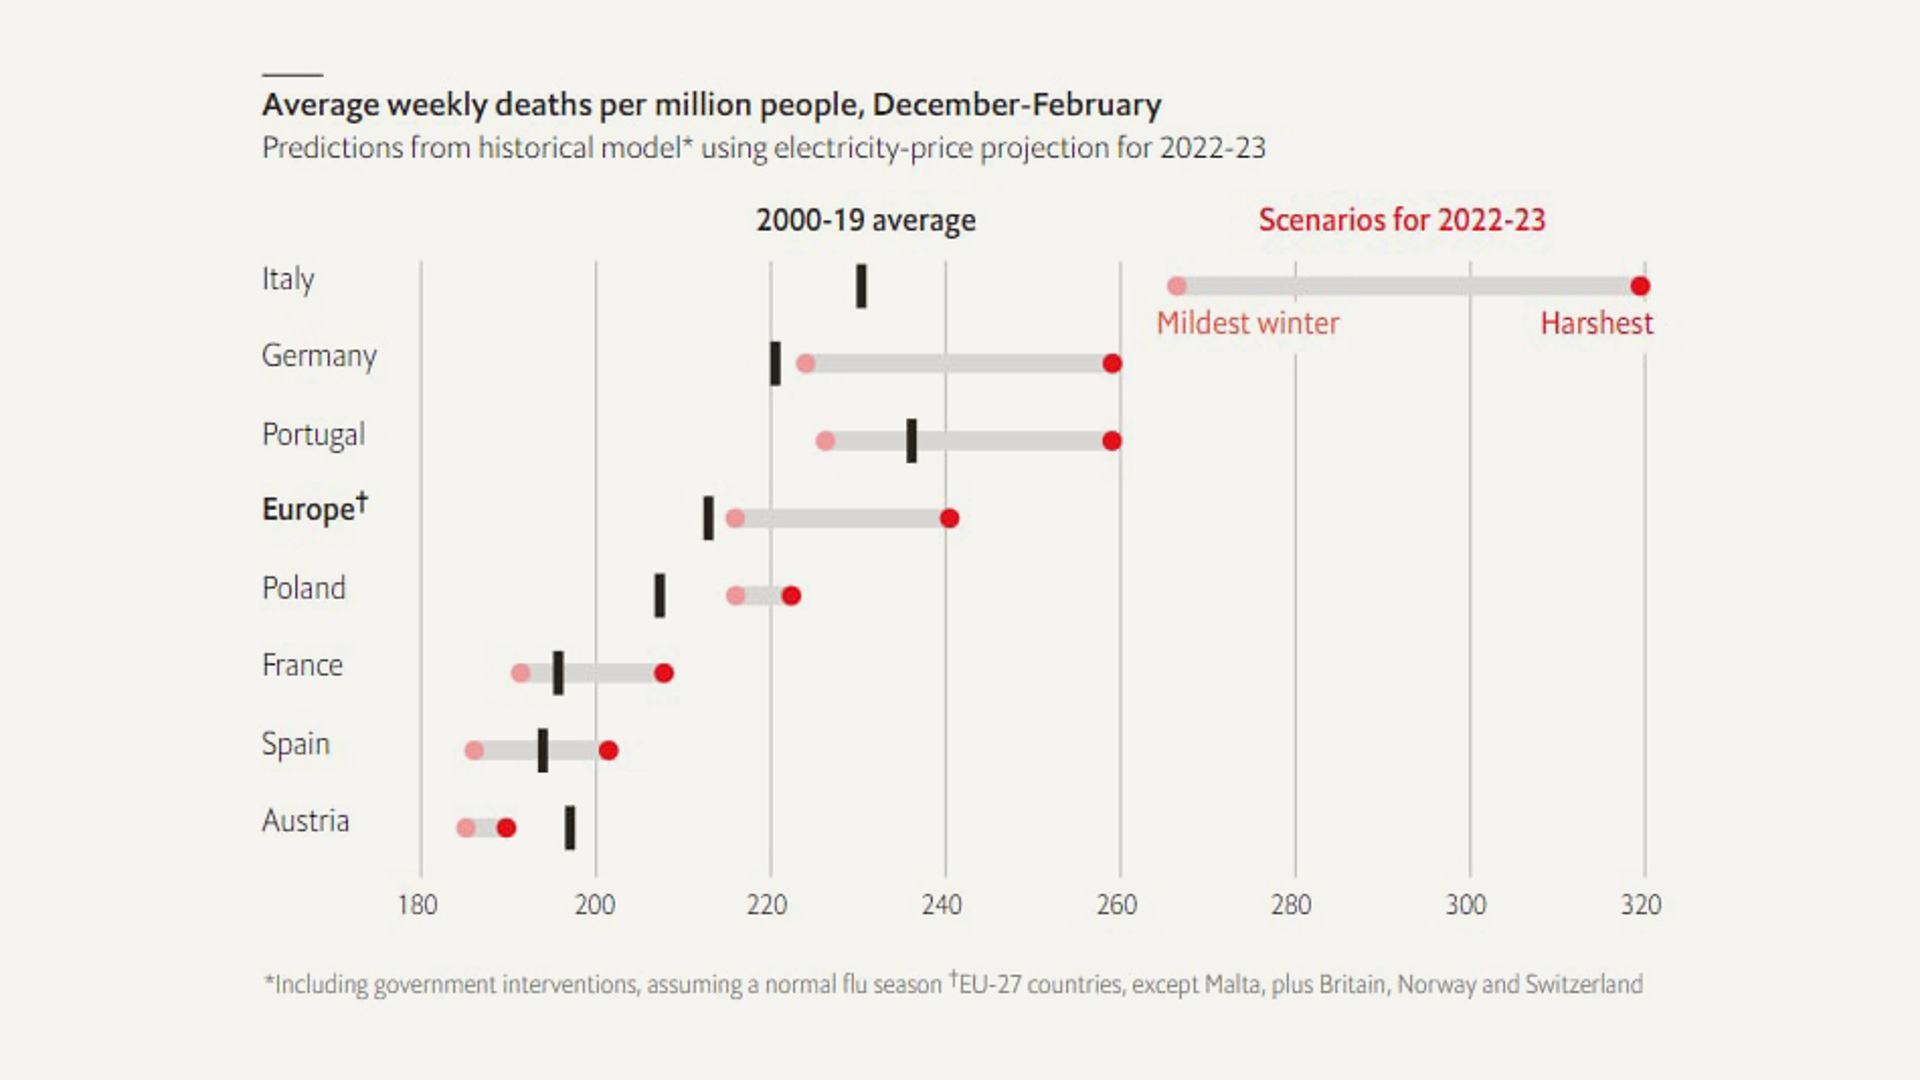
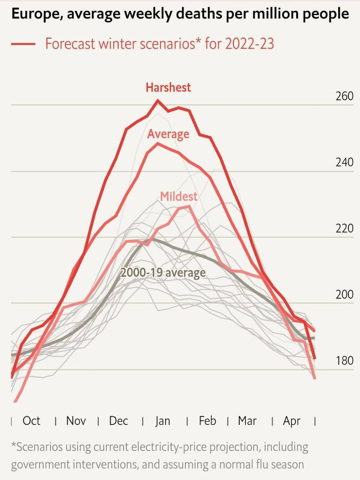
Высокие цены на топливо зимой увеличат смертность в странах ЕС на 4,8% по сравнению с прошлыми годами в случае обычной зимы. К такому выводу пришли эксперты британского издания The Economist после расчетов статистической модели развития событий.

Без учета пандемии при ценах на электроэнергию, близких к их нынешним уровням, грядущей зимой при обычных температурах погибнет примерно на 147 000 человек больше, или на 4,8% больше, чем в среднем, подсчитал The Economist. Это необъяснимая жертва ради отказа от российского топлива.

При теплой зиме смертность вырастет слабее – на 79 000 смертей, что на 2,7% больше среднегодовой смертности. В случае холодной зимы – при температуре ниже среднегодовой в ЕС – в Евросоюзе смертность вырастет на 185 000 в среднем, или на 6% по сравнению с обычной смертностью зимой, когда цена отопления была ниже – до 2020 года. Суровая зима может забрать 335 000 дополнительных жизней европейцев сверх среднего исторического значения в ряде стран.

Многократный рост расходов европейцев на энергию вынудит людей экономить на тепле и увеличит влияние холода на рост смертности. Математическая модель учитывает господдержку – обещанные субсидии зимой на отопление и электроэнергию. Пандемия Сovid-19 может повысить смертность.

Учитывая среднюю погоду в ЕС за предыдущие годы, статистическая модель The Economist утверждает, что рост цен на электроэнергию на 10% повышает смертность на 0,6% в любой сезон по сравнению с показателями за предыдущие годы. Академическое исследование американских данных в 2019 году дало аналогичную оценку.

В последние десятилетия цена отопления оказывала лишь незначительное влияние на зимнюю смертность, поскольку цены колебались в довольно узком диапазоне, а энергия была дешевой. Но сейчас рост счетов за электричество и отопление – многократный.

В типичной европейской стране летом повышение цены на электроэнергию увеличила еженедельную смертность всего на 3%. Но суровая зима может увеличить смертность даже на 12% в худшем варианте в некоторых странах.

Рост стоимости электроэнергии с поправкой на инфляцию с 2020 года на 60% больше в среднем, чем в 2000-2019 годах. Но в Италии, где стоимость электроэнергии выросла почти на 200% с 2020 года, экстраполяция линейной зависимости дает чрезвычайно высокие оценки смертности – на 320 000 больше, чем обычно.

Холод в квартирах европейцев повышает тяжесть заболеваний гриппом и рост простудных заболеваний. Холод подавляет иммунную систему, заставляет людей меньше гулять. Кровь в таких условиях сгущается и повышается ее давление, что повышает риск сердечных приступов и инсультов.

Now on arXiv.org "Effects of stochastic and natural seismic noise on the performance of waveform cross-correlation used to recover low-magnitude seismicity prior to the July 29, 2025, Kamchatka earthquake"

arXiv.org link :  [2607.16226] Effects of stochastic and natural seismic noise on the performance of waveform cross-correlation used to reco...