7/27/10

Xilinx share price

This is a funny example. According to our approach discussed in [1], the model for Xilinx (XLNX) is defined by the index of communication (CO-CUUR0000SAE2) and that of information and information processing (INF-CUUR0000SAE21). The former CPI component leads the share price by 11 months and the latter one leads by 4 months. From our past experience, the larger is the lag the more unreliable is the model. These defining components provide the best fit model, i.e. the lowermost RMS residual error, between August 2009 and June 2010. Both coefficients in the XLNX model are positive. This means that the decreasing price of communication and information (see Figure 1) forces the share price down.

So, the best-fit 2-C model for XLNX(t) is as follows:

XLNX(t) = 4.05CO(t-11) + 3.54INF(t-4) +0 .17(t-2000) + 33.25

The predicted curve in Figure 2 leads the observed price by 4 months with the residual error of $1.92 for the period between July 2003 and June 2010. In other words, the price of a XLNX share is completely defined by the behaviour of these two CPI components.

The model accurately predicts the share price in the past and foresees no significant change in the next quarter, in July through September 2010. Considering the overall fall in the S&P 500 in 2010, one should not expect any growth in this stock price at all.

Figure 1. Evolution of the price index of communication (CO) and information (INF).

Figure 2. Observed and predicted XLNX share prices.

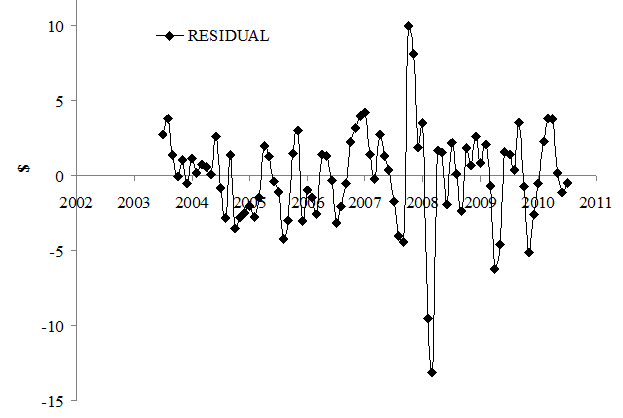
Figure 3. Residual error of the model. Mean residual error is 0 with standard deviation of $1.92. The largest errors were observed in 2004 and 2005.

References
Kitov, I. (2010). Deterministic mechanics of pricing. Saarbrucken, Germany, LAP Lambert Academic Publishing.

Ball Corporation share price

According to [1], the model for Ball Corporation (BLL) is defined by the index of motor vehicle maintenance and repair (MVR- CUUR0000SETD) and that of communication (CO- CUUR0000SAE2). The former CPI component leads the share price by 13 months and the latter one leads by 2 months. These defining components provide the best fit model between August 2009 and June 2010.

So, the best-fit 2-C model for BLL(t) is as follows:

BLLB(t) = 2.66MVR (t-13) – 5.84(t-2) - 20.44(t-2000) + 321.46

The predicted curve in Figure 1 leads the observed price by 2 months with the residual error of $2.42 for the period between July 2003 and June 2010. In other words, the price of a BLL share is completely defined by the behaviour of the two CPI components.

The model does predict the share price in the past and foresee a significant fall in the near future. This drop will be in line with the overall fall in the S&P 500 in 2010.

Figure 1. Observed and predicted BLL share prices. Black diamonds present the original forecast shifted 2 months ahead.

References
Kitov, I. (2010). Deterministic mechanics of pricing. Saarbrucken, Germany, LAP Lambert Academic Publishing.

Schlumberger share price

According to [1], the model for Schlumberger Limited (SLB) is defined by the index of meat and meats, poultry, fish and eggs (MEAT- CUUR0000SAF112) and that of information technology (IT- CUUR0000SEEE). The former CPI component leads the share price by 2 months and the latter one leads by 6 months. Figure 1 depicts the overall evolution of both involved indices. However, both defining components provide the best fit model between August 2009 and June 2010. Both coefficients and the slope of time trend are negative.
So, the best-fit 2-C model for SLB(t) is as follows:

SLB(t) = -3.56MEAT(t-2) – 48.58IT(t-6) - 30.24(t-2000) + 1858.34

The predicted curve in Figure 2 leads the observed price by 2 months with the residual error of $6.30 for the period between July 2003 and June 2010. In other words, the price of a SLB share is completely defined by the behaviour of the two CPI components.

The model does predict the share price in the past and foresee a significant fall in the near future. This drop will be in line with the overall fall in the S&P 500 in 2010.
Figure 1. Evolution of the price of MEAT and IT.

Figure 2. Observed and predicted SLB share prices. Original prediction is shown by red line. Black diamonds present the original line shifted 2 months ahead.


Figure 3. Residual error of the model. Mean residual error is 0 with standard deviation of $6.30. The largest errors were observed in 2008.

References
Kitov, I. (2010). Deterministic mechanics of pricing. Saarbrucken, Germany, LAP Lambert Academic Publishing.

7/26/10

Solow on economics as a science

Robert Solow prepared a statement “Building a Science of Economics for the Real World” for the House Committee on Science and Technology, Subcommittee on Investigations and Oversight. It was presented on July 20, 2010. It is worth reading as a wonderful sample of an absolutely helpless and hopeless piece. The dry residual for science (I mean here the hard sciences) is zero. The outcome for the author criticizing a competitive “school of thought” and real economy model, a DSGE model in this case, is counterproductive.


As a matter of fact, I admire the overall discussion between mainstream economists and terminology they use to demolish rivals. Specifically, Prof. Solow used a 100% scientific term “smell” when characterized the problems and contradictions in the DSGE. It seems like a dog is sniffing around for a specific smell of other dogs …

Scientifically, if a model can not predict observations and does not pass rigorous statistical tests - it is wrong. No more, no less. In this blog, our articles, papers, and monographs, we develop, present and test only models, which do predict observations of macroeconomic variables in developed countries: real GDP, price inflation, unemployment, labor force level, S&P 500 stock market index.

We do not say that our models are 100% correct, despite they are statistically right. The logic says that correlation does not mean causality. But the absence of correlation, as all mainstream models demonstrate, 100% guarantees the absence of causality and true models. The DSGE is not excluded.

HPQ share price

According to [1], the model for Hewlett-Packard (HPQ) is defined by the index of food less beverages (FB) and that of rent of primary residency (RPR). The former CPI component leads the share price by 4 months and the latter one leads by 5 months. Figure 1 depicts the overall evolution of both involved indices. However, these two defining components provide the best fit model between August 2009 and June 2010. One coefficients is negative and one is positive together with time trend, with slope of 3.64.


So, the best-fit 2-C model for HPQ(t) is as follows:

HPG(t) = -3.20FB(t-4) +2.91RPR(t-5) + 3.64(t-2000) - 50.82

The predicted curve in Figure 2 leads the observed price by 4 months with the residual error of $2.13 for the period between July 2003 and June 2010. In other words, the price of a HPQ share is completely defined by the behaviour of the two CPI components.

The model does predict the share price in the past and foresees a fall in 2010. It will be in line with the overall fall in the S&P 500 in 2010.

Figure 1. Evolution of the price of DAIRY and TPU.
Figure 2. Observed and predicted HPQ share prices. Original prediction is shown by red line. Black diamonds present the original line shifted 4 months ahead, i.e. the model.

Figure 3. Residual error of the model. Mean residual error is 0 with standard deviation of $2.13. The largest errors were observed in 2007.

References
Kitov, I. (2010). Deterministic mechanics of pricing. Saarbrucken, Germany, LAP Lambert Academic Publishing.

MMM share price

According to [1], the model for 3M Company (MMM) is defined by the index of dairy products (DAIRY- CUUS0000SEFJ) and that of public transportation (TPU- CUUS0000SETG). The former CPI component leads the share price by 10 months and the latter one leads by 6 months. Figure 1 depicts the overall evolution of both involved indices. However, both defining components provide the best fit model between August 2009 and June 2010. Both coefficients are negative and only positive time trend with slope of 8.7 has been compensating the negative input of both CPIs .

So, the best-fit 2-C model for MMM(t) is as follows:

MMM(t) = -0.74DAIRY(t-10) – 0.54TPUP(t-6) + 8.70(t-2000) + 180.88


The predicted curve in Figure 2 leads the observed price by 6 (!) months with the residual error of $3.79 for the period between July 2003 and June 2010. In other words, the price of a MMM share is completely defined by the behaviour of the two CPI components.


The model does predict the share price in the past and foresee a significant fall in the last quarter of 2010, i.e. through December 2010. It will be in line with the overall fall in the S&P 500 in 2010.

Figure 1. Evolution of the price of DAIRY and TPU.


Figure 2. Observed and predicted MMM share prices. Original prediction is shown by red line. Black diamonds present the original line shifted 6 months ahead.


Figure 3. Residual error of the model. Mean residual error is 0 with standard deviation of $3.79. The largest errors were observed in 2005 and 2006.


References
Kitov, I. (2010). Deterministic mechanics of pricing. Saarbrucken, Germany, LAP Lambert Academic Publishing.

7/25/10

Predicting DeVry's share price

According to [1], the model for DeVry (DV) is defined by the index for the rent of primary residency (RPR-CUUS0000SEHA) and that of pets, pet products and services (PETS-CUUR0000SERB). The former CPI component leads the share price by 11 months and the latter one leads by 4 months. Figure 1 depicts the overall evolution of both involved indices. From our past experience, the larger is the lag the more unreliable is the model. However, both defining components provide the best fit model between August 2009 and June 2010. The positive influence of RPR (+7.90) is compensated by the negative input of all other terms . So, the best-fit 2-C model for DV(t) is as follows:


DV(t) =7 .90RPR(t-11) – 2.76PETS(t-4) - 35.73(t-2000) - 757.63


The predicted curve in Figure 2 leads the observed price by 4 months with the residual error of $3.24 for the period between July 2003 and June 2010. In other words, the price of a DV share is completely defined by the behaviour of the two CPI components.


The model does predict the share price in the past and foresees A significant fall in the next quarter, i.e. through September 2010. It will be in line with the overall fall in the S&P 500 in 2010.


Figure 1. Evolution of the price of RPR and PETS.


Figure 2. Observed and predicted DV share prices . Original predcition is shown by red line. Black diamonds present the original prediction shifted by 4 months ahead.


Figure 3. Residual error of the model. Mean residual error is 0 with standard deviation of $3.24. The largest errors were observed in 2007 and 2008.


References


Kitov, I. (2010). Deterministic mechanics of pricing. Saarbrucken, Germany, LAP Lambert Academic Publishing.

Now on arXiv.org "Effects of stochastic and natural seismic noise on the performance of waveform cross-correlation used to recover low-magnitude seismicity prior to the July 29, 2025, Kamchatka earthquake"

arXiv.org link :  [2607.16226] Effects of stochastic and natural seismic noise on the performance of waveform cross-correlation used to reco...