As discussed in our working paper, there exists a trade-off between the growth rate of real GDP, G(t), and the S&P 500 returns, R(t). The predicted returns, Rp(t), can be obtained from the following relationship:
Rp(t) = 0.0062dlnG(t) - 0.01,
where G(t) is represented by (six month moving average) MA(6) of the (annualized) growth rate during six previous months or two quarters, because only quarterly readings of real GDP are available.
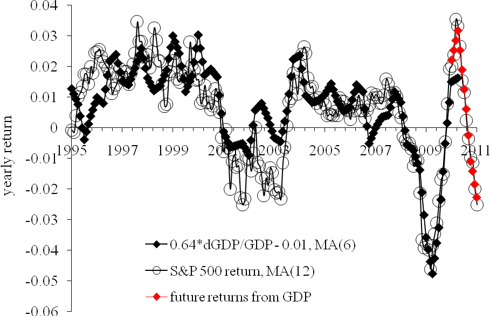
Figure 1 displays the observed S&P 500 returns and those obtained using real GDP, as presented by the US Bureau of Economic Analysis. The observed returns are MA(12) of the monthly returns. The period after 1996 is relatively well predicted including the increase in 2003. Therefore, it is reasonable to assume that G(t) can be used for modeling of the S&P 500 index and returns. Reciprocally, current S&P 500 may be used for the estimation of GDP.
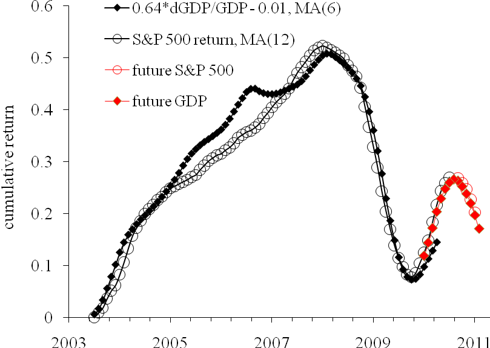
In the previous article, we have predicted the future of S&P 500 and its returns. Now we invert the predicted figures and calculate real GDP for the same period. The bets-fit GDP figures are obtained from the cumulative curves shown in Figure 2. Our estimates from 2009Q3 to 2010Q4 are shown by red circles and red diamonds. The estimated GDP growth rates are as follows:
2009Q3: 3% (2.2%)2009Q4: 7% (5.6%)
2010Q1: 6% (2.6%)
2010Q2: +2%
2010Q3: -2%
2010Q4: -3%
In the brackets, the current estimates of the growth rate of real GDP are given, which will be all revised in July 2010. So, our model shows that GDP was slightly underestimated in the second half of 2009 and heavily underestimated in the first quarter of 2010. In 2010Q2 the growth will slow down and then a period of GDP contraction will start. Some people call it the second wave of crisis. This is what our model foresees.

Figure 1. Observed and predicted S&P 500 returns 1985 to 2011.The future S&P 500 returns are converted into GDP growth rates. Corresponding re-estimates of the returns are shown by red diamonds.

Figure 2. Cumulative observed and predicted S&P 500 returns. Red diamonds represent GDP figures which fit the predicted S&P 500 returns.


No comments:
Post a Comment