Italy chooses the future today in the elections. This future can be prosperous but also may continue the epic economic failure observed during the period of EU membership. This post explains in simple numbers the extremely poor economic performance. As an economy, Italy demonstrated the worst performance in the 21st century among developed countries, and this observation is strictly related to its participation in the EU.
In this post, data and general consideration are partially borrowed from my paper "Real GDP per capita: global redistribution of economic power" published in 2021 and available on arxiv.org. Our paper presents the performance of many countries as measured by the annual increment in the real GDP per capita. The main source of data for the Figures below is Maddison Project Database 2020. | Releases. Groningen Growth and Development Centre. University of Groningen - rug.nl. In a good country, people have to have more and more money in their pockets. The annual money increment is the best measure of personal and country-wise prosperity growth. Italy was not the worst in Europe in the second part of the 20s century but lost its momentum after joining the EU.
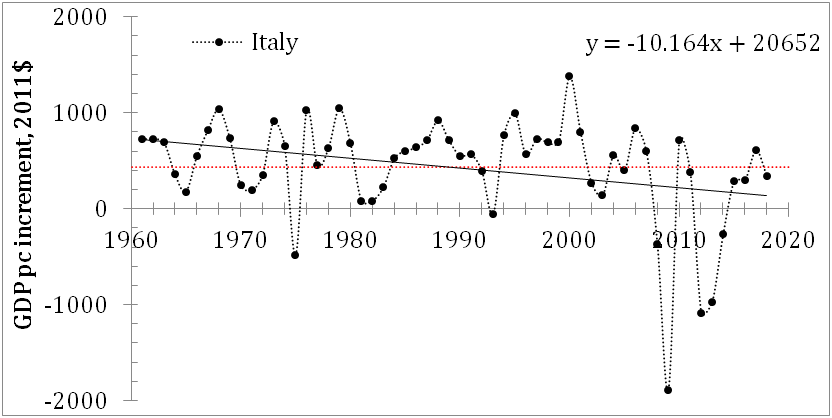
Figure 1 illustrates the shift in Italy to slower growth around the year 2000 with negative figures in the real GDP per capita, GDPpc, increment in 2008, 2009, and from 2012 to 2014. (The period covered in the paper is limited to 2018 and the COVID-19 recession is not included, but it definitely made the Italian economic performance much worse in the 21st century. The events in 2022 will likely result in another recession which will be especially deep in Italy as the 2008-2009 recession was.) Figure 1 also shows that the GDPpc level in 2018 is lower than the peak value observed in 2007. (Currently, Italy is likely below the 1999 level.)
The length and extent of this failure have not been observed in the data for Italy after 1960. The average annual increment for the whole period between 1960 and 2018 is $430±$546, and in the most recent period after 2001: $92±$740. The average annual increment of $92 is only 15% of that observed in Italy between 1961 and 2000. (Italians have much lower annual money increments than Germans or even the French, which is another loser of the EU.) The scattering is much larger than in France after 2001 (see paper). We also used the OECD and TED (Total Economy Database) estimates for the period between 2001 and 2018 and they are both negative -$43±$727 and -$61±$926, respectively, and much lower than +$92 reported by the MPD, which is likely in favor of Italia. (The OECD does not report the GDPpc before 1970 and it is not possible to compare estimates for the period between 1961 and 2000.) The regression line in the upper panel in Figure 1 has a negative slope and the annual increment decreases by $10.1 per year on average. The dependence of the growth rate of the GDPpc (lower panel) is characterized by loops for negative increments and the cycle of deep falls and quick rebounds generate high scattering as measured in the most recent period.


The European
Central Bank may cause an uneven reaction of the previously independent
economies with various economic measures undertaken against inflation and slow growth rate.
Germany significantly increased its annual increment in real GDP per capita
since the mid-1990s. Spain, Italy, and France suffer a painful decrease in the
annual increment in the 21st century. There is no direct evidence
that EU participation is the only cause of the drop in economic performance
but the difference between the periods before and after 2000 makes the Economic
and Monetary Union the main suspect.

Figure 3. Real GDP per capita (2011 prices) in
selected EU countries. Data are obtained from the Maddison Project database.
Figure 3 compares several EU countries and splits the
period from 1960 to 2018 into three sub-periods: 1960-1979, 1980-1999, and
2000-2018. Statistically, variations in the annual increment in the GDPpc
between these periods are important for the estimates of the linear regression,
i.e. the long-term behavior. We have
formulated this decay in terms of the gradual loss of economic competitiveness
(efficiency) compared to Germany within the EU. This situation is likely fixed
and neither Italy nor France is able to get back to the pre-EU level. The case of the UK, which is also
demonstrating lower performance than Germany and the Kingdom of the
Netherlands, gives a reasonable solution – to leave the EU and fight for the
efficiency out of the EU framework which they actually do not control. Portugal
and Spain should probably join such a move.
If the EU is a multi-speed union then Italy and Portugal are driving in
first gear.


No comments:
Post a Comment