In September 2009, we reported that the price index of crude oil had been likely evolving in sync with that of iron and steel, but with a lag of two months. In order to present both indices in a comparable form, the difference between a given index, iPPI, and the overall PPI was normalized to the PPI: (iPPI(t)-PPI(t))/PPI(t). The normalized differences represent the evolution of the rate of deviation from the PPI over years.
Figure 1 depicts corresponding time histories of the normalized deviations from the PPI. Simple visual inspection reveals the following feature: the (normalized deviation from the PPI of the) index of iron and steel lags by two months behind the (normalized) index of crude oil.
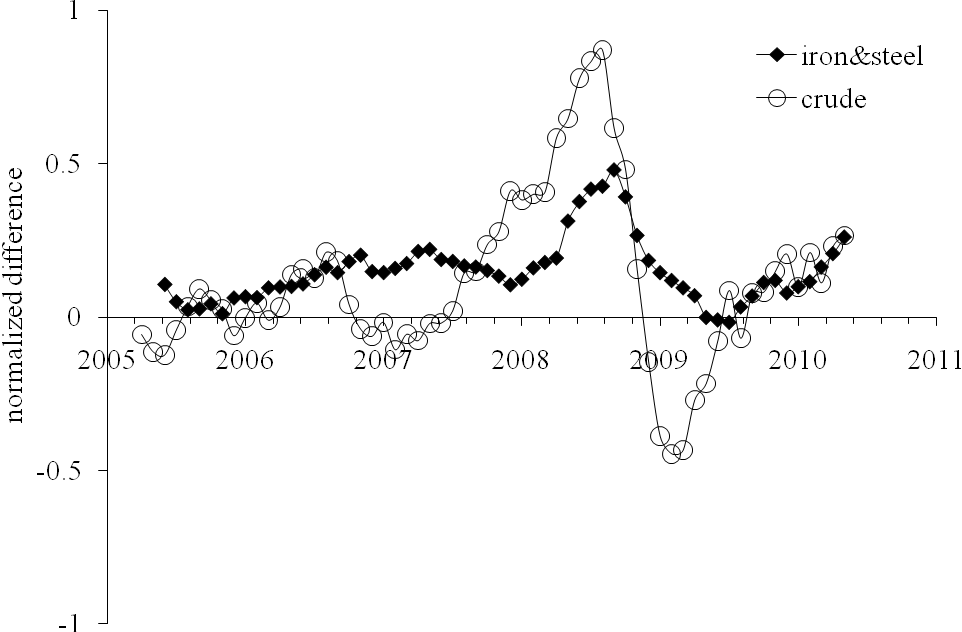
Figure 1. The deviation of the iron and steel price index and the index of crude oil from the PPI, normalized to the PPI.
In order to reduce both deviations to the same scale we additionally normalized the curves in Figure 1 to their peak values between 2005 and 2009:
(iPPI(t)-PPI(t))/[PPI(t)*max{iPPI-PPI)}]
This scaling allows a direct comparison of corresponding shapes. In Figure 2, we display the normalized index of iron and steel shifted by two months ahead to synchronize its peak with that observed in the normalized index for crude petroleum. The scaled index of crude demonstrates just minor discrepancies from the index of iron and steel in the overall shape and timing of the peak and trough. Simple smoothing with MA(3) makes the curves resemblance even better. As an invaluable benefit of the resemblance, one can use the two-month lag to predict the future of the iron and steel price index.
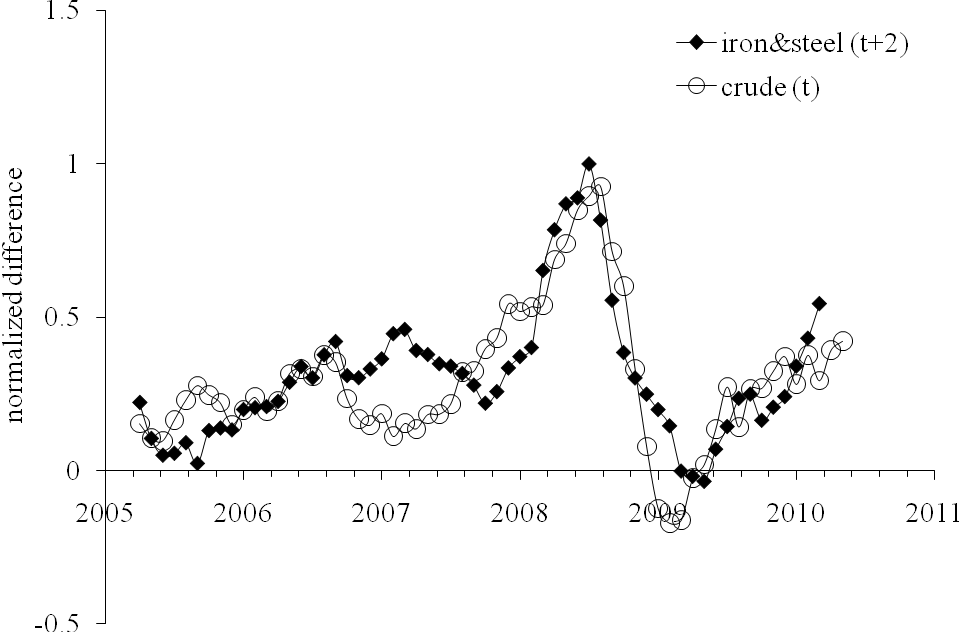
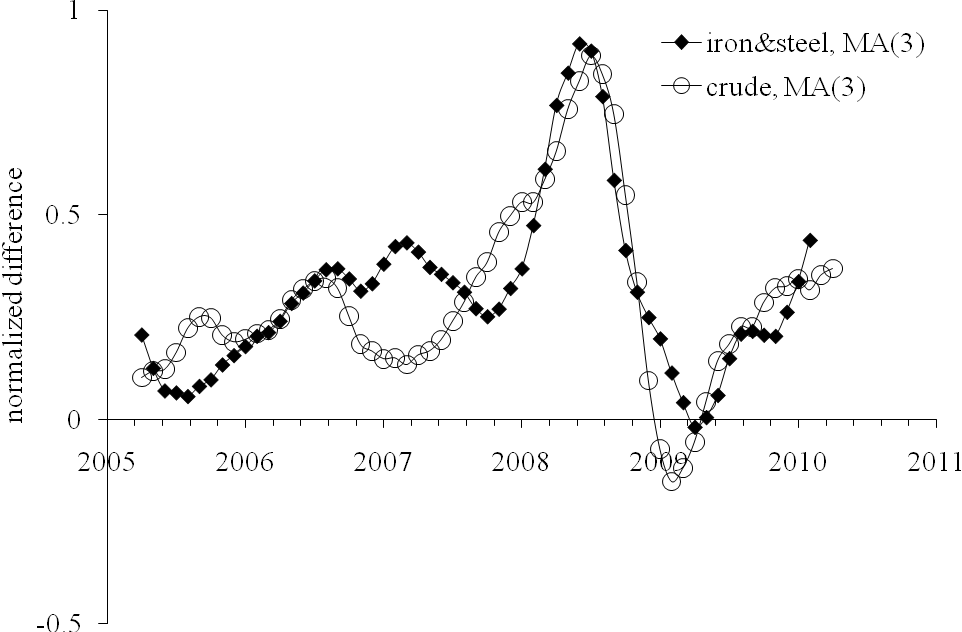
Figure 2. Deviation of the iron and steel price index from the PPI, normalized to the PPI and the peak value after 2005 as compared to the deviations of the index for crude petroleum normalized in the same way. The normalized index for iron and steel is shifted two months ahead.
Conclusion
Between 2006 and 2010, the deviation of the price index of iron and steel from the PPI in the USA repeats the trajectory of the deviation of the index of crude petroleum (domestic production) with a two-month lag. Therefore, the prediction of iron and steel price for at this horizon is a straightforward one. It is likely that in 2010 the index of iron and steel will approach closely the level attained in August 2008. From this level, it will be declining in the long run following the new trend of oil price, as shown in our previous post.
References
Kitov, I., Kitov, O., (2009). Sustainable trends in producer price indices, Journal of Applied Research in Finance, Spiru Haret University, Faculty of Financial Management and Accounting Craiova, vol. I(1(1)_ Summ), pp. 43-51


No comments:
Post a Comment