10/27/23

Immigration to the US makes real GDP to grow at 3% per year

 The most recent statistics published by the BEA says a lot about Bidenomics. First, it works! The annualized quarter to quarter growth is 4.9% (Figure 1) and the annual growth rate close to 3% (Figure 2). All negative side of this growth are insignificant, as the Biden team insists. This is not true, unfortunately. The illegal immigration drives the demand side of the economics and inflation will be growing as the real GDP growth is not intensive due to productivity but rather extensive - 10 million new consumers.  When immigration stops, real GDP will drop. 

Figure 1. Q/Q real GDP growth rate since 1960


Figure 1. Y/Y real GDP growth rate since 1960


10/7/23

What does mean "world"? Or how to find racists

 I watch some videos from different sources saying that the "world" condemns Hamas. At the same time, many videos show support from Arab countries. It seems that those who say "world condemns Hamas" exclude Arab countries. It sounds like they are racists and call for apartheid.  

10/2/23

нацистский скандал в канадском парламенте. Разница между западными и незападными евреями

Запад дал однозначный ответ по результатам Второй мировой. Руководители Германии, посмевшие напасть за запад, приговорены к смерти и длительным срокам. Исполнители, воевавшие с СССР, это воины правды и герои. Их спасли для дальнейшего использования. Единственная загвоздка это холокост. С этой проблемой вроде тоже справились. Смерть незападных евреев больше преступлением не является. Назовите хоть одного восточного еврея известного как Анна Франк. Преступники, казнившие евреев в Бабьем Яру и поляков на Волыни, это борцы с СССР.

Не подчинившиеся США страны являются их врагами. Не враги США это страны подчинившиеся им. США поддерживает нацистов, убивающих русских. Это решение запада после Второй мировой. Однозначно. По-другому и не было. Надо пересмотреть наши союзнические отношения во время ВОВ. Запад воевал против Германии, напавшей на них. Запад не воевал с нами, а использовал против Германии.

9/9/23

The U.S. will never get back to the (visible) prosperity of the 1950s

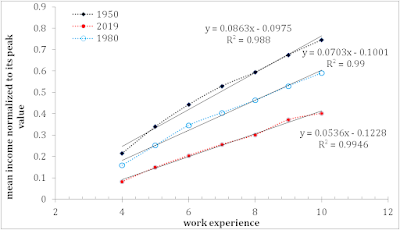
The 1950s and 1960s were the years of U.S. prosperity as many people think.  This was the middle-class era. People recall it with nostalgia. Let's take a look at the reasons behind the optimism of the 1950s. Figure 1 below shows the evolution of the mean income with age. The age bins for the mean income estimates are 1 year of work experience and the data are obtained from IPUMS.  We compare the years of 1950, 1990, and 2019. To compare data from different years we normalized all estimates to the peak mean income for a given year (Figure 2 displays the normalized mean income evolution in 1950, 1980, and 1990).  As a result, we observe in the figure the relative mean income growth with age experience (starting at the age of 16).

One can see that in 1950 people with 10 years of work experience had 75% of the peak income. In 1990, this share dropped below 60%. In 2019, the mean income with 10 years of work experience was just above half of that in 1950 - 40%. Therefore, the rate of income growth has a long-term decline in the younger age group where people create families and raise children. It was easy in the 1950s and 1960s. And it is almost impossible in the 2020s for a majority of the U.S. population. Unfortunately, the peak age for the mean income increases as a square root of the real GDP per capita. The future of U.S. society is defined by income growth - the chance for young people to create families and raise children will diminish with real economic growth. The visible prosperity of the 1950s will never return. 

Figure 1. The normalized mean income evolution for young people.

Figure 2. The normalized mean income evolution 


9/8/23

Wind is fading away in the UK. Will the natural gas price grow?

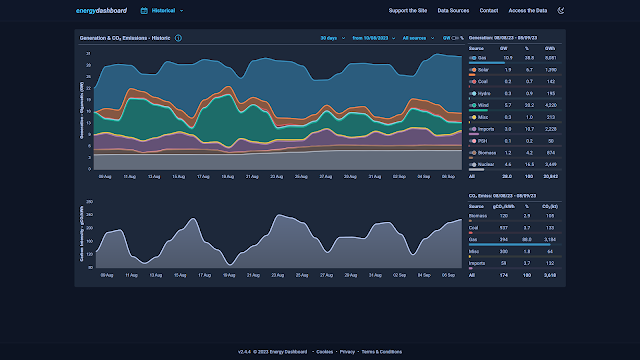
There exists an important source of information on the energy production in the US with the detailed spit into sources: Energy Dashboard - real time and historical GB electricity data, carbon emissions and UK generation sites mapping

The data shown below cover different periods of time from 7 days to 90 days. The (natural) gas price crisis in 2021 started with the low wind energy production in the UK. The last two weeks are characterized by very low wind energy production and significant growth in gas energy production in the UK.


Lenght         Gas, %     Wind,%    Imports, %

7 days          43             12.1          11.8

14 days       42.8           12.7          11.2                   

30 days      38.8            22.2          10.7

90 days      34.8            23.7          12.1 


9/5/23

Distinguishing the aftershock sequences of the DPRK5 and DPRK6 underground nuclear tests

 The seismic (likely aftershock) activity within the DPRK site has been increasing since May 2023. This is a very unusual observation and the paper from 2021 regains its importance. I am going to write a new paper on the current seismic activity which is hard to explain by natural processes.


AbstractThe rate of aftershocks in the sequence initiated by the DPRK underground tests has been increasing since January 2021. In total, 22 reliable aftershocks were detected between January 13 and October 1, 2021. Their characteristics are similar to the aftershocks in one of two clusters: 1) the fifth DPRK (DPRK5) test (mb(IDC)=5.09) conducted on September 9, 2016, which induced the first DPRK aftershock in the sequence detected at 1:50:48 UTC on September 11, 2016; 2) the sixth DPRK (DPRK6) explosion (mb(IDC)=6.07), which generates its aftershock sequence with characteristics significantly different from the aftershocks in the DPRK5 sequence. The length, intensity, and alternating character of these sequences suggest specific mechanisms of energy release likely associated with the interaction of the damaged zones of the DPRK5 and DPRK6 and the collapse of their cavities with progressive propagation of the collapsing chimneys to the free surface. According to the depth estimates based on the moment tensor modelling, the DPRK5 and DPRK6 were conducted at practically the same depths. The difference in magnitudes suggests that their damaged zones differ by a factor of 2 or more. The first aftershock of the DPRK6 (mb(IDC=4.12) 8.5 minutes after the test is evidence of the cavity collapse and creation of a chimney, which did not reach the surface. The activity in 2021 indicates that the chimney collapse is not finished yet. One can expect more aftershocks in the near future, likely ended with the chimney reaching the free surface. 

Gender income disparity in the USA

 This paper "Gender income disparity in the USA: analysis and dynamic modelling" is also of interest


Abstract

We analyze and develop a quantitative model describing the evolution of personal income distribution (PID) for males and females in the U.S. between 1930 and 2014. The overall microeconomic model, which we introduced ten years ago, accurately predicts the change in mean income as a function of age as well as the dependence on age of the portion of people distributed according to the Pareto law. As a result, we have precisely described the change in the Gini ratio since the start of income measurements in 1947. The overall population consists of two genders, however, which have different income distributions. The difference between incomes earned by male and female populations has been experiencing dramatic changes over time. Here, we model the internal dynamics of men’s and women’s PIDs separately and then describe their relative contribution to the overall PID. Our original model is refined to match all principal gender-dependent observations. We found that women in the U.S. are deprived of higher job positions (work capital). This is the cause of the long-term income inequality between males and females in the U.S. It is unjust to women and has a negative effect on real economic growth. Women have been catching up since the 1960s and that improves the performance of the U.S. economy. It will take decades, however, to full income equality between genders. There are no new defining parameters included in the model except the critical age when people start to lose their incomes, which was split into two critical ages for low-middle incomes and the highest incomes, which obey a power law distribution. Such an extension becomes necessary in order to match the observation that the female population in the earlier 1960s was practically not represented in the highest incomes. In the overall model, the male population dominates in the top income range and the difference between two critical ages is masked. Gender versions of the refined model provide consistent quantitative descriptions of the principal features in the male and female income distribution.

Now on arXiv.org "Effects of stochastic and natural seismic noise on the performance of waveform cross-correlation used to recover low-magnitude seismicity prior to the July 29, 2025, Kamchatka earthquake"

arXiv.org link :  [2607.16226] Effects of stochastic and natural seismic noise on the performance of waveform cross-correlation used to reco...