12/15/20

Growth rate of the GDP per capita revisited. 4. Latin America

Looking into the MPD data for Latin America, one can see that the overall economic performance is much worse than in the developed countries as expressed by the mean annual increment in the GDP per capita. In this section, we present the results of the analysis for ten countries: Argentina, Bolivia, Brasilia, Chile, Colombia, Costa Rica, Cuba, the Dominican Republic, Mexico, and Uruguay. This list is not complete and includes the biggest and a few mid-size and small economies. In the biggest economies (Argentina, Brasilia, and Mexico) the linear regression (black) line of the annual increment per capita is very close to the (dashed red) mean line. This observation is in line with our model of inertial economic growth with constant annual increment. 

The major problem of Latin America is that the average annual increment of the GDP per capita is by a factor of 4 to 10 lower than that observed in the biggest developed countries. The best performers like Ireland and Norway are excluded from this comparison – no country in Latin America is even a good performer like an average west European country. In relative terms, the low annual increment is equivalent to poor performance. Smaller economies demonstrate various examples of slower and faster growth between 1960 and 2018, but no country has an average GDPpc above $264 (2011 prices) as measured for Chile. At the same time, there is a tendency that economic performance in the 21st century is much better in the poorest economies. This observation makes our assessment of the future economic progress in Latin America a little bit more optimistic. 


Figure 1. Argentina. The upper panel: the annual GDPpc increment between 1961 and 2018 with the average value for the studied period of $167 (2011 prices). The middle panel: the same annual increment as a function of GDPpc level. The lower panel: the relative growth rate of the GDPpc as a function of the GDPpc.


Figure 2. Same as in Figure 1 for Bolivia.


Figure 3. Same as in Figure 1 for Brasilia.


Figure 4. Same as in Figure 1 for Chile. 


Figure 5. Same as in Figure 1 for Colombia.


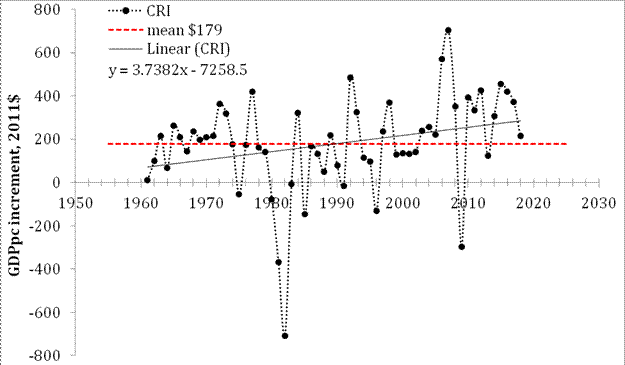
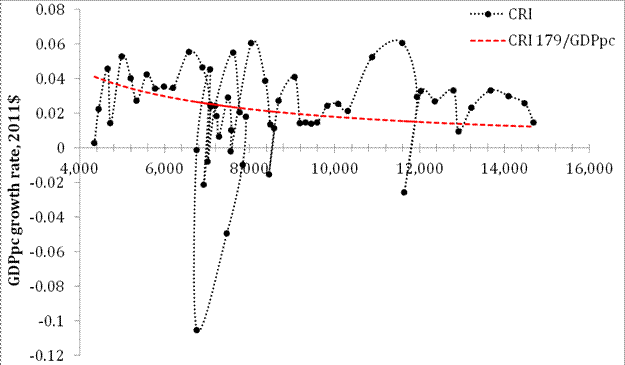
Figure 6. Same as in Figure 1 for Costa Rica.


Figure 7. Same as in Figure 1 for Cuba.


Figure 8. Same as in Figure 1 for the Dominican Republic.


Figure 9. Same as in Figure 1 for Mexico.


 Figure 10. Same as in Figure 1 for Uruguay.

12/14/20

Growth rate of the GDP per capita revisited. 4. Positive outliers

The MPD gives many examples of poor economic performance, which can be explained by various reasons and causes. These reasons are usually very convincing. In this section, we present the results of real GDP per capita analysis for nine small and mid-size countries demonstrating extremely high economic performance: Norway, Ireland, South Korea, Singapore, Taiwan, Hong Kong, Saudi Arabia, Bahrain, Qatar, and Oman. The reasons for such excellent performance are less self-explanatory. We are not going to discuss these reasons here and just present data and the overall misfit with our model. These countries are small and have one-sided economics. They do not influence the global economy and we can consider them as exotic but insignificant outliers.   


Figure 1. Norway. The upper panel: the annual GDPpc increment between 1961 and 2018 with the average value for the studied period of $1260 (2011 prices). The middle panel: the same annual increment as a function of GDPpc level. The lower panel: the relative growth rate of the GDPpc as a function of the GDPpc.


Figure 2. Same as in Figure 1 for Ireland. 


Figure 3. Same as in Figure 1 for South Korea. 


Figure 4. Same as in Figure 1 for Hong Kong. 


Figure 5. Same as in Figure 1 for Taiwan.


Figure 6. Same as in Figure 1 for Saudi Arabia.


Figure 7. Same as in Figure 1 for Qatar.


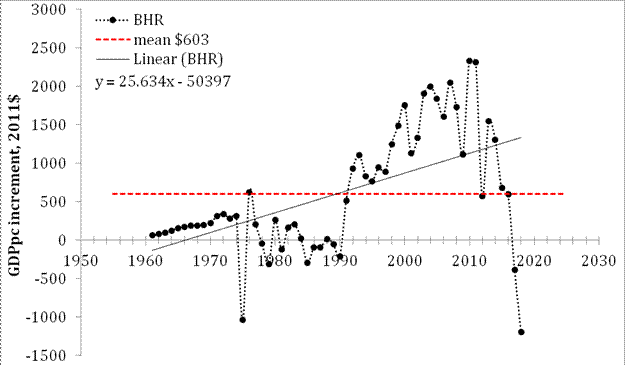
Figure 8. Same as in Figure 1 for Bahrain.


Figure 9. Same as in Figure 1 for Oman.


Now on arXiv.org "Effects of stochastic and natural seismic noise on the performance of waveform cross-correlation used to recover low-magnitude seismicity prior to the July 29, 2025, Kamchatka earthquake"

arXiv.org link :  [2607.16226] Effects of stochastic and natural seismic noise on the performance of waveform cross-correlation used to reco...