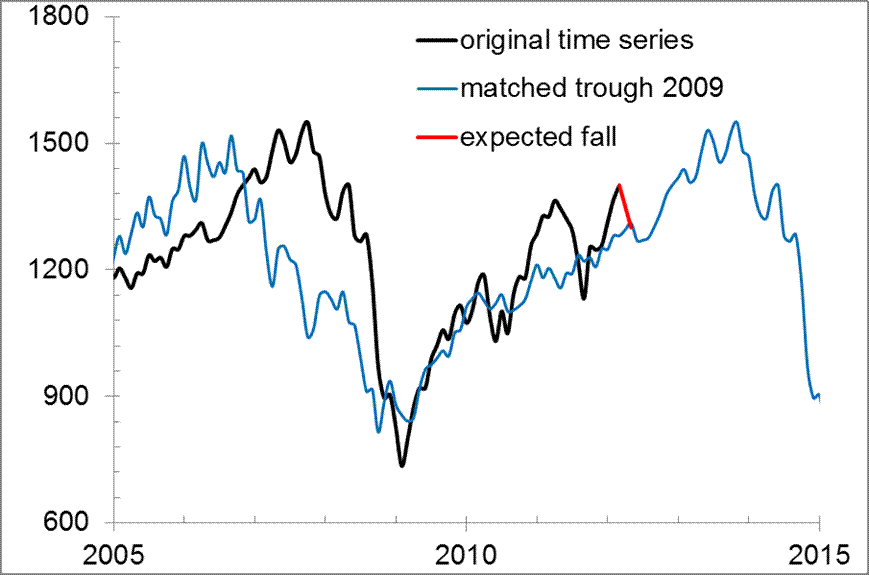
This article is re-published from Oilprice.com and is in line with my prediction from 2007 that oil price would peak and then fall down to $30 to $60 in 2016.
Oil Prices Could Drop Substantially: An Interview with Michael Levi
There's been plenty of talk about potentially radical US foreign policy changes as a result of the shale boom. While one shouldn't expect any dramatic US foreign policy move away from the Middle East, factors are influencing a greater focus on Asia. Only one thing is certain in this transforming world: The shale boom is real and the implications are many and difficult to predict.
In an exclusive interview with
Oilprice.com publisher James Stafford, energy security expert
Michael Levi, the David M. Rubenstein Senior Fellow for Energy and the Environment and Director of the Program on Energy Security and Climate Change at the Council on Foreign Relations (CFR), discusses:
- Why oil price stability is still all about the Middle East
- Why the oil and gas industry is heading towards transformation
- Why oil prices could drop substantially
- Why the US shale boom is real
- Why the shale oil boom won't lead to major US foreign policy changes
- Why Keystone XL is pretty much non-essential
- Why we won't see any radical change in renewables in the next five years
- The best way to achieve meaningful results on climate change
James Stafford: What is the number one threat to energy security today?
Michael Levi: I am not a huge fan of using the word 'energy security' because it means different things to different people, and that makes it very easy for people to talk past each other. What I would say the number one risk to the stability of global oil prices--which can have big economic and security ramifications--is the potential for major conflict in the Middle East and instability in oil-producing countries.
James Stafford: Are there any other regions that have this same destabilizing potential?
Michael Levi: The Middle East is always the place where focus is rightly drawn, because it is the place where you can have outsized disruptions. One of the things that I tend to emphasize is the need to focus and prioritize concerns, and it is very easy to get [drawn into] every 100,000 or 200,000-barrel-a- day change somewhere in the world that might have big consequences for one particular country, but does not necessarily have outsized global consequences or national consequences that policymakers need to think about. If I spend my time trying to think through what policymakers should be paying attention to, my focus, when it comes to disruptions to the oil system, tends to come back to the Middle East.
James Stafford: The UK-based think tank Chatham House has
published a new report seeking to demonstrate how the oil and gas industry is under significant pressure that will lead to a transformation. How do you see a potential transformation of the industry taking shape?
Michael Levi: I think it is important to start with a distinction, particularly one that is important in the US: the oil and gas sectors, to some extent, are becoming two genuinely separate sectors, rather than one integrated one.
In the past, most natural gas was produced as associated gas together with oil, and that made oil and gas as a single entity very clear, something that made a lot of sense. Now you have a lot of non-associated gas; gas being produced separately, often by companies that do not engage in much oil production. They really have distinct challenges and opportunities, and as a result, different sets of pressures.
For the natural gas industry, at least in the US, the big challenges are low prices in the glut of gas on the market that is not being matched by demand. A big part of this is certainly idiosyncratic; there are people who are drilling to hold leases and cash flow, and they are doing that en masse, which is a problem for the whole industry.
At the same time, they have not been able to coalesce around the efforts to boost demand.
The oil world is a completely different story and you have pressures from different directions right now. On the one hand, you have a surge in opportunities for development in countries where geopolitical risks are relatively low. In the US, Canada, and Brazil you may need to still worry about regulatory changes, but you are not worried that terrorists will come and capture your workers.
At the same time, for a lot of the companies, that is not enough and they are still looking globally, and they still face challenges from nationalism and unstable regimes. On top of that, they are entering a period in which there is probably more uncertainty in prices than there has been for a long time. You have this collision of growth and supply from
outside OPEC, together with potential Iraqi growth and substantial investment from within OPEC that really opens up the possibility of a big, if temporary, price drop in the next five or
so years. That complicates the outlook for companies, on top of everything else.
James Stafford: Really? You believe that prices could drop in the future?
Michael Levi: I think prices could drop substantially. If you look at the most recent IEA report or the most recent OPEC outlook, you see that if all currently planned investment goes ahead, then at prices resembling current ones, supply would greatly outstrip demand.
Either countries will pull back with production and investment
in OPEC and allow supply to match demand at relatively high prices--and I think that is the most likely outcome--or they will not be able to decide who has to pull back, and there will be an excess of supply on the market that pushes prices down quickly. That is self-correcting, because low prices cannot sustain the big gains in North American production. But you can still have temporarily low prices that really shake things up for some producers, depending on the properties of their investment.
James Stafford: Speaking of the IEA report, predictions that the US could pass Saudi Arabia to become the world's largest oil producer by 2017 have come under a lot of criticism. What do you think of the IEA's predictive mathematics?
Michael Levi: Predictions are always wrong in one way or another, and I am not going to second-guess those who have thought to a much greater depth in these analyses. There is a range of estimates out there, but the IEA ones are relatively modest.
The bigger issue is: what are the implications? Everyone likes to talk about how their projections show that the world is being reborn anew, and will be fundamentally different from what it was in the past.
There is a temptation to oversell, and I think it is reasonable that people react negatively to efforts to oversell the consequences of the changes going on in energy.
James Stafford: What are your views on the shale boom? Do you believe it can live up to the hype?
Michael Levi: It depends on what hype we are talking about. I think the shale boom is for real. I think that a lot of the criticism that we do not know long-term production rates and so on are important to look at. But even if you assume that returns on wells are substantially lower than most people think they are right now, our projected output is still quite high, because producers' economics are dependent primarily on what happens in first few years after they drill. We know roughly what happens in the first years after producers drill.
The hype that says that this will all replace coal without any government intervention, gas prices will be $3 forever, or that we will be the dominant exporter in the world, are out of contact with reality. We have temporarily depressed prices, they will rise a bit. Hype always has the ability and the tendency to outstrip reality, but in this case, reality is pretty radical itself.
James Stafford: Could the shale boom lead to a change in US foreign policy priorities, away from the Middle East?
Michael Levi: An economic analyst will typically tell you that the US shale boom will fundamentally change US vulnerability to energy events in the Middle East. But not every policymaker listens to their economic advisors.
I do not think that US policymakers will step back and say, 'We need to revisit our strategy in the world, because of this oil boom.' I do think that what is happening will weigh on ongoing
discussions that already exist about future US priorities.
The most obvious one is the discussion from the US Department of Defense over how much to shift from the Middle East to Asia. Within that existing debate, I have no doubt that people who want to see more of a shift will emphasize what is happening in US energy. I think it will have some influence, but ultimately, I do not see a radical change as being likely.
James Stafford: Now that Barack Obama has won a second term, what do you see happening with the Keystone XL Pipeline? Will it go ahead? Is it essential to US energy security?
Michael Levi: I made a prediction once on the Keystone XL Pipeline, so I have lost my license to make future predictions. The Keystone XL Pipeline is non-essential to US energy security; it is also not disastrous to climate change. It has been overblown by both sides in the debate. It is one pipeline that would carry a modest, but non-trivial amount of crude, and that would help create economic incentives to increase production, again, by a modest but not earth-shattering amount.
The more fundamental question is whether the US is going to let economically-rational infrastructure go ahead. I think if you replicate a pattern like the one that some would like to see for Keystone and you start blocking pipelines all over the place, then that becomes a larger economic problem.
In the end, will it make the US more secure in any meaningful way? I doubt it. Prices for Canadian oil rose more during the Libya conflict than the prices for Brent Crude, or WTI. It is hard to say that Canada gives the US potentially more security aside from in extreme circumstances.
James Stafford: One would have thought that the natural gas boom would be good for the environment, but the cheap gas prices have also hit coal prices, and we are seeing Europe sucking up unused US coal. Is this a trend we can expect to continue?
Michael Levi: I think it is a trend we can expect to continue to some extent, particularly if Europe does not make stronger moves away from coal. The state of our knowledge about global coal markets is pathetic. All we can say right now is, directionally, more gas in the US means cheaper coal, which leads to more exports, but we are still far from being able to really put quantitative meat on those bones, and making some meaningful net assessment.
James Stafford: What do you believe is the best way to achieve meaningful results on climate change? How much of an influence will Hurricane Sandy have on this debate?
Michael Levi: I think Hurricane Sandy has put the debates into a prominent place, which is essential to moving it forward.
Ultimately, I still believe that carbon pricing in one form or another is essential to achieving deep cuts in economically-sensible ways. That can come in the form of a tax, resurgent cap and trade, or clean energy standard; there are all sorts of ways to do carbon pricing. In the long haul, I think you come back to that, particularly if you care about doing this is an economically-efficient way.
James Stafford: What changes in public interest on climate change have you noticed over the years? Do you think that at this rate climate change will ever gain the support it needs to be effectively tackled?
Michael Levi: Ever is a long time. I think we are back in a building phase. If you look at the first decade of this century, you had a solid 5 or 6 years that was really about building broad support for action on climate change, about test driving different approaches, and by the time you got to 2008, there was actually pretty broad support, particularly in the Senate for action on climate change. You had 2 presidential candidates competing to see who had the best climate strategy. Then you had the financial crises. You had intense polarization. You had a deep, deep recession, and climate action became a much lower priority.
A lot of people got used to saying in early 2009 that we would come back to climate change when the economy got better. The only mistake that people made in that analysis was thinking that that was only a couple years off. It turns out that it is even further off.
One of the emerging barriers to action on climate change is that doing things to exploit oil and gas have been set up as 100% incompatible with serious efforts to deal with climate change. That stark choice makes it very difficult to build coalitions that will move anything forward. We have actually moved in the last couple of years into a considerably more difficult situation than we were even 4 years ago, when a candidate like John McCain could say, 'I support oil and gas production, and I support a strong cap and trade system.' The president talks about things like that today, but gets considerably weaker support for it, and that ultimately needs to change.
James Stafford: How can this change?
Michael Levi: I have a
book out next spring, talking about this. The first step is for each side to recognize that accepting a lot of what his opponents want will not fatally undermine what it wants. Oil and gas will need to understand that serious action on climate change will not fundamentally undermine what they want to accomplish in the next decade or two. People who want to take action on climate change need to fundamentally understand that expanding access to US oil and gas production will not fatally undermine their own goals. Compromise is not an oxymoron.
The second thing that needs to happen is there needs to be some rebuilding of trust. That is difficult; you do not just do it by hanging out more at the bar. You need to do small deals that show that you can work together.
You can think of all sorts of ideas; you could tie royalties from increased oil and gas production to financial support for renewable energy. You could provide support for carbon capture and storage demonstrations that support enhanced oil recovery. You can work to improve environmental permitting so it is easier to build pipelines and power lines that take renewable energy to places where they can be used.
There are a host of things that are small (but not trivial) win-wins that might help rebuild confidence. Ultimately, both sides need to accept that a political deal is better than trying to go for an outright win.
James Stafford: What role do you see renewable energy playing in the future?
Michael Levi: In the near future, renewable is cost-competitive in niches, but it is still not broadly competitive in the US economy. It has a potential to be.
Renewables have cost and intermittency challenges. There is important progress that is being made in renewable energy. I think a lot of that story has been buried in the oil and gas discussion in the last couple of years, but we are seeing record-low prices across the board, and we are seeing record-high deployments. It is important to remember that we still need government support in all these areas if you actually want to see costs come down meaningfully.
James Stafford: How do you define the ‘near future'?
Michael Levi: I do not see a radical change in the relative price of renewable energy and fossil fuels in the next 5 years. Ten years is more difficult to predict, but I would be skeptical. When you start to look ahead one or two decades, particularly when you add in policy uncertainty, it is very difficult to predict what will happen.
James Stafford: Can the US afford to turn its back on nuclear energy?
Michael Levi: If you mean by turning its back, you mean a phasing-out of nuclear energy, I do not think that is sensible to do. Nuclear energy provides 20% of our electricity, and the marginal cost of production is extremely low for existing power plants. The real question is can the US afford to turn its back on nuclear in the future as a source of zero-carbon energy growth? The answer is: we do not know, because we do not know what the alternatives will be, or if there will be significant alternatives. So you want to keep nuclear alive as an option; that means trying to figure out ways to bring down costs, particularly financing costs. It means looking for ways to resolve, or at least partly resolve the waste questions, and it means looking for ways to potentially innovate on small modular reactors to provide a different economic model and a different construction model for nuclear power.