11/14/12

An updated model of Loews' share price: a large positive correction is expected


We have been reporting on the performance of our share price model for Loews Corporation (NYSE: L) since 2010. In March 2012, we presented an updated model including data available for February 2012 and predicted a slight price growth in Q2. Actually, the (monthly closing adjusted for splits and dividends) price grew from $39.02 in February to $41.0 in April, with a following slight decrease to 40.85 in June.  Here we update the model with the closing price through October 2012 and the (not seasonally adjusted) consumer price indices for September 2012. We have found that the share price may grow by $6 in December 2012 – January 2012 timeframe and definitely might be considered as a potentially good investment idea. The standard deviation of our model since June 2003 is only $2.43 and the increment of $5 is definitely above the uncertainty bounds.  At the same time, there were short periods of large deviation between the predicted and observed curve, e.g. in 2010.  

The model is based on the decomposition into a weighted sum of two consumer price indices (selected from a larger set of CPIs), linear trend and constant; all coefficients and time lags to be estimated by a LSQ procedure. A month ago we presented a quarterly report and confirmed the stability of the original model obtained in September 2009 for the period through October 2008. Here we test the previous model and make a regular update using new data. All in all, the original model is valid since October 2008 and does not show any clear sign of changes in the future. This is a reliable model valid during the past 60 months!

A preliminary model for Loews Corp. was obtained in September 2009 and covered the period from October 2008. This old model included the index of food without beverages (FB) which led by 6 months and the index of transportation service (TS) with a 4 months lead: 

L(t) = -2.52FB(t-6) – 1.38TS(t-4) +27.93(t-1990) + 377.24, stdev=$2.04,  September 2009 

where L(t) is the share price in US dollars, t is calendar time.  

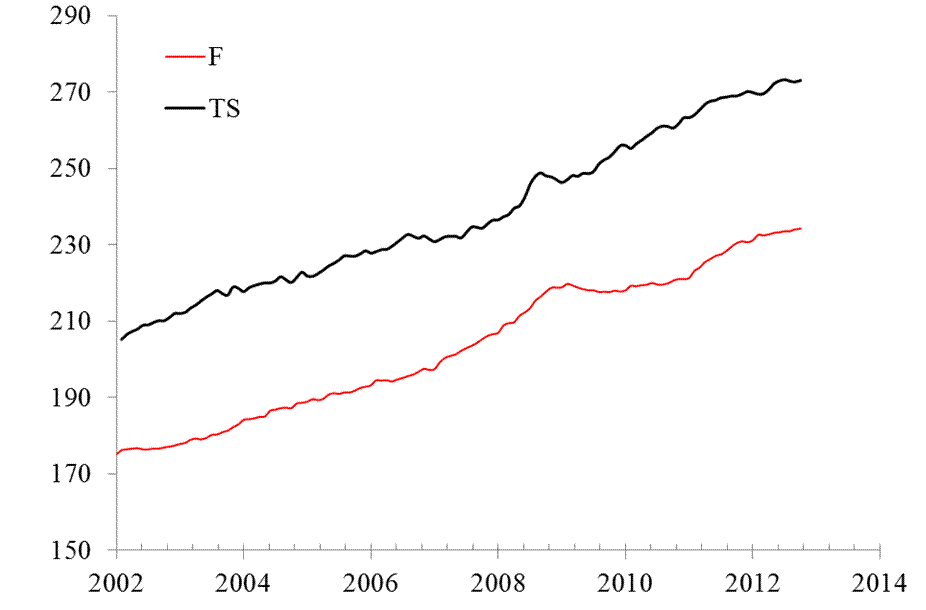
Since November 2010, the defining indices were the same: the index of food and beverages (F) and the TS index. Figure 1 depicts the evolution of the indices which provide the best fit model, i.e. the lowermost RMS residual error, between July 2003 and October 2012.  The food and beverages index leads by 5 months and the TS index by 4 months.  The model does not show any tangible change with time - only coefficients have been slightly fluctuating:


L(t) = -2.04F(t-5) – 2.08TS(t-4) +28.09(t-1990) + 441.81, Nov. 2010

L(t) = -2.03F(t-5) – 2.12TS(t-4) +28.23(t-1990) + 448.98, March 2011

L(t) = -2.01F(t-5) – 2.09TS(t-4) +27.96(t-1990) +440.65, Sept. 2011

L(t) = -2.03F(t-5) – 2.02TS(t-4) +27.65(t-1990) +431.99, Dec. 2011

L(t) = -2.01F(t-5) – 2.01TS(t-4) +27.49(t-1990) +428.70, stdev=$2.41, Feb. 2012

L(t) = -2.00F(t-5) – 1.96TS(t-4) +27.18(t-2000) +693.99, stdev=$2.43, Sept. 2012      

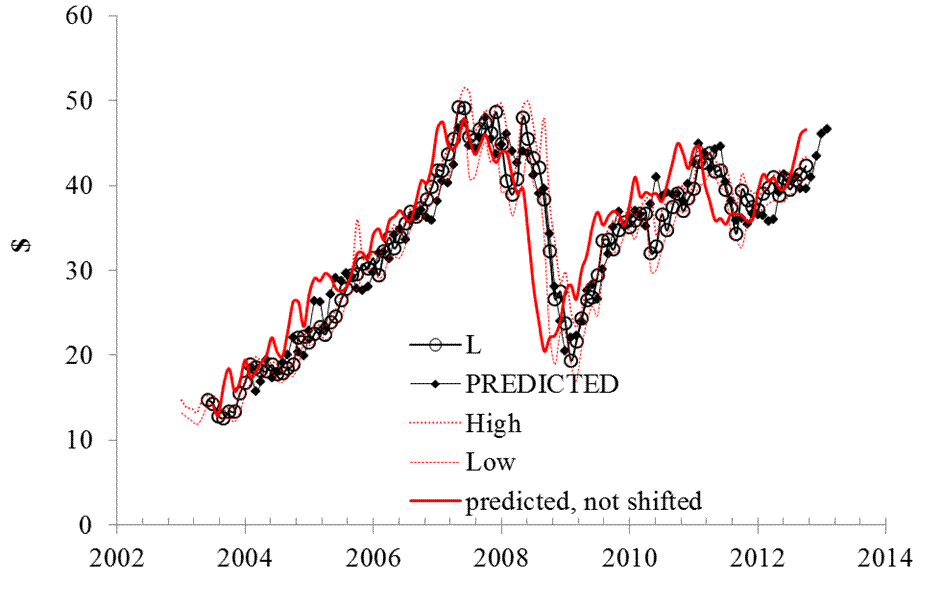
The current model is depicted in Figure 2 together with high and low monthly prices as a proxy to the uncertainty bound of the share price. The predicted curve leads the observed one by 4 months. The solid red line presents the contemporary prediction, i.e. one sees four months ahead. Major falls and rises are well forecasted four months in advance. It is worth noting that the model obtained in March 2011, accurately predicted the small fall observed in the second and third quarters of 2011.   The model residual error is of $2.43 for the period between July 2003 and October 2011, as shown in Figure 3.


Figure 1. Evolution of the price indices F and TS. 


Figure 2. Observed and predicted share prices. 


Figure 3. The model residual error; stdev=$2.43.

Re-published from Oilprice.com: Interview with Emperor Oil CEO Andrew McCarthy

Oilprice.com re-publishes some of my posts and this is the first time I do the same with an article from their site.

High Risk Investing - The New Trend in Energy: Interview with Emperor Oil CEO Andrew McCarthy
Risk perception isn’t what it used to be. Ask the swelling ranks of Canadian junior oil and gas companies braving high-risk venues like Sudan, Iraq and even Yemen.
Technological advances and the shale revolution are making risk easier to digest. And political risk is no longer limited to developing countries. Plus, risk is increasingly relative: Ask anyone who’s been caught up in the politics of the Keystone pipeline.
Sudan is a case in point. While instability and a very fragile peace with South Sudan remains a threat, there is also growing optimism. The philosophy is this: Sudan and South Sudan will come to terms for the sake of economic growth, and oil will get them there. The prize: An estimated 5 billion barrels of oil.
In an exclusive interview with Oilprice.com publisher James Stafford, Emperor Oil CEO Andrew McCarthy reveals:
• Why investors are hitting up high-risk regions
• Why Africa is more opportunity than risk
• How political risk is no longer limited to developing countries
• Why Shale WILL live up to the hype
• Why conventional oil is still a great investment
• And why human ingenuity will prevail

Emperor Oil (TSXV: EM.V) is an international oil and gas company with a focus on the Middle East and North Africa. Most recently, the company has renegotiated the terms of a joint venture gas deal in Turkey and introduced a significant conventional oil project in Sudan.
James Stafford: Oil and gas juniors are now setting up shop in high-risk countries like Sudan, Iraq and even Yemen. What’s behind this new era of risk, and are we likely to see more of this?
Andrew McCarthy: This question creates an opportunity for risk comparison – is it less risky to drill a mile below the ocean surface and create the kind of disaster we saw BP (NYSE: BP) deal with in the Gulf, or do we continue to look for work in regions that have accessible resources and are anxious to advance their economic position along with the health and welfare of their community?
James Stafford: So you are saying that on a comparative level even North America has become a political risk? And that in this balancing act, volatile places like Sudan do not necessarily pose any greater political risk?
Andrew McCarthy: Yes, there are always risks associated with any investment. The US halted all exploration in the Gulf of Mexico for extended periods following the BP disaster. This is a risk that few would have foreseen when exploration and development began in a country whose level of political risk is considered to be negligible.
James Stafford: Furthering your point, there have been a number of other unforeseen political risks, both in the US and Europe…
Andrew McCarthy: Certainly. The US banned all exploration and production in the Marcellus Shales in the State of New York. The US has also stalled the construction of Keystone XL pipeline that would link the US to Canada’s oil sands. In Canada, we have seen the province of British Columbia place a moratorium on offshore drilling. Across the Atlantic, we have also seen Europe place a moratorium on all shale exploration and development.
James Stafford: What is your message to investors who still view Africa and the Middle East as too risky?
Andrew McCarthy: Based on all of these North American and European developments, is it any less risky than operating in developing countries?
James Stafford: Which brings us to Emperor’s operations in Sudan. When South Sudan declared independence in July 2011 it took with it some 75% of the known oil resources. Since then, the situation between Juba (the capital of South Sudan) and Khartoum (the capital of Sudan) has been tense and even bloody. How will this affect exploration and extraction?
Andrew McCarthy: Well, now we have healthy competition due to the secession of the south and the need for both countries to maximize their economic opportunity. The skirmishes fought in the spring were quickly squelched when both countries realized the impact it was having on their economy and their people. Rather than fight over existing production they have chosen to expand their resource development so that there is a larger pie to share.
There have certainly been many difficulties over the years but the country recently emerged from a democratic process that the South secede in a diplomatic fashion. Both countries are now keen to advance, and the competition to succeed is healthy and beneficial. Of course, one also has to remember how truly enormous this country is and how remote some of the areas are in which much of the oil reserves are located.
James Stafford: There is also the question of infrastructure. South Sudan is seeking alternatives to transiting oil through Sudan, and Juba is extremely optimistic about the prospects of a new pipeline from South Sudan to Kenya. This is all part of Kenya’s massive regional infrastructure plan—the $24.7 billion Lamu Port-South-Sudan-Ethiopia Transit corridor (LAPSSET). How feasible is this pipeline? What are the implications for Khartoum?
How much would Khartoum stand to lose in transport revenues if this pipeline is realized?
Andrew McCarthy: I think this is an unnecessary undertaking that will be difficult to finance for many different reasons. Pipelines are exorbitantly expensive to build and would seem especially unnecessary given the fact that they could face similar problems to those which they have just overcome in Sudan [in terms of prohibitively high transit fees].
It is doubtful that a new pipeline would have any negative effects in Sudan. If anything it would likely cause the country to push for further exploration and production so as to maximize the infrastructure already in place.
James Stafford: The International Energy Agency (IEA) forecasts a drop in Sudan’s oil production through 2017. This contradicts Sudan’s own projections that it could double production in the next two years. How realistic is this?
Andrew McCarthy: I think that they are more than realistic. The main pipeline and port in Sudan is more than capable of handling the capacity. The resources are proven and available.
James Stafford: Despite the problems between Juba and Khartoum, Emperor seems confident that development and production will proceed without interruption. Can you tell us more about your recent progress in Sudan that boosts this optimism?
Andrew McCarthy: Emperor has signed an MOU to acquire a 42.5% interest in concession Block 7 in Sudan. The other 57.5% is owned by the country’s energy company, Sudapet. Block 7 is 10,000 sq km in size and tens of millions have been spent on the property. The property has 3 discovery wells which have been drilled, capped and are waiting for production. Initial production will be shipped by truck using existing roads which connect the property to the country’s main pipeline, located approximately 60kms away. A tie-in pipeline will be constructed during the second phase of development.
James Stafford: Beyond Sudan, another key area of focus for Emperor has been Turkey, a key strategic player in Middle East oil and gas, where oil majors like Chevron Corporation (NYSE: CVX) and ExxonMobil (NYSE: XOM) have significant interests. What can you tell us about Emperor’s recent activities here?
Andrew McCarthy: Emperor has a JV agreement with a partner in the Catalca Block in Turkey’s Thrace Basin. A major gas discovery was made on the property, which is located 30 kilometers west of Istanbul and only 5 kilometers from the natural gas pipeline supplying the country. The short-term plan is to complete the discovery well and connect it with the pipeline tie-in located only 5kms away. The long-term plan is to drill 5-10 more wells and expand the resource significantly.
James Stafford: In high-risk countries, what should investors look for risk mitigation?
Andrew McCarthy: Management with experience and diplomatic skills; a country with a history and commendable track record in negotiation and resolution; resource potential; development costs; production curves.
James Stafford: Certainly, the reverse would be true as well?
Andrew McCarthy: Yes. In Sudan, for instance, Canadians have an excellent reputation for quality work. They embrace the community and are willing to share their technologies and knowledge with the local people. Canadians are seen as net contributors and effective partners whose relationships are valued.
James Stafford: How are technological advances contributing to the juniors’ readiness to operate in risky territory?
Andrew McCarthy: With ever improving technical advantages in extraction methods I believe we will see more opportunities for resources which have a lower cost structure. Shale oil and gas developments will continue to evolve and conventional oil will have to compete on a cost level. Traditional extraction methods won’t have the same exploration budgets nor will they be able to compete unless the extraction is simple and inexpensive. I believe this is why we are starting to see a renewed interest in Africa and South America.
Energy reserves are abundant, they are often defined by past work and are inexpensive, efficient and safe to extract. This creates a significant advantage that can in many cases offset the political and geopolitical risk that was once associated with these parts of the world.
I also see the world becoming a safer place. Modern communication has improved access to information and changed people’s basic needs to wants and desires. Resource development creates employment and wealth – the cornerstone from which luxury and comfort is attained. Energy development is fundamental to advancing social, economic, health and safety standards for the world.
James Stafford: On a broader level, does natural gas have much further to fall, or have we seen the bottom?
Andrew McCarthy: I think we have seen a bottom in North America but Europe’s moratorium on shale exploration and China’s environmental concerns and air quality issues create a huge demand for natural gas, which in turn creates a long-term, sustainable model for natural gas exploration, development and export.
James Stafford: Will the shale revolution live up to the hype?
Andrew McCarthy: I really don’t believe the hype has even started yet. Unfortunately, the uninitiated are still focusing on the concept of ‘fracking’, while this is in fact one of the oldest technologies. We’ve been ‘fracking’ oil and gas wells since the 1930s. What has changed and continues to change is the technology applied – do you know they actually use CAT scan equipment to check shale porosity? It’s truly a fascinating region of science. The shale oil developers refer to 2010 like its ancient history and there is no reason to expect this rapid pace of development and advancement to slow.
James Stafford: While shale is currently the hot item, which sector will be the next big thing for energy investors?
Andrew McCarthy: Conventional oil is an excellent place to invest if you can find opportunities in areas that have excellent resources and are overcoming or mitigating their political risk. I think that technology stocks which are focused on the energy sector create wonderful investment opportunities. We are in a technological revolution in this industry. When people speak of peak oil they should first realize that the issue is energy – not oil. And in order to talk about a peak we have to eliminate the human factor – man’s creativity, ingenuity, invention and design always has and always will prevail.
Source: http://oilprice.com/Interviews/High-Risk-Investing-The-New-Trend-in-Energy-Interview-with-Andrew-McCarthy.html
11/13/12

AutoNation's share may fall down to $35 in 2012Q4


Here we revisit our price model for AutoNations’ (NYSE: AN), which we have been modeling since 2009.  In March 2012, we presented a brand new prediction for AN; we expected no large changes in the first half of 2012. At least the price was not expected to go out of the uncertainty bounds defined by monthly high/low prices. This prediction was right. The AN (monthly closing) price was hovering around $35 before it started to grow in July and reached the level of $44 in September 2012. Our current model shown the price to fall back to $35 in the months to come. The closing price for the 12th of November was $40.56, i.e. approximately 10% down from the October’s closing price. The model suggests that no recommendation to buy AN should be given and there is no reason to keep it in the short run (few months). We will revisit the model in two-three months. 

AutoNations’ is a company from services sector (as defined by the S&P 500) and operates as an automotive retailer in the U.S. here we present the current model which has been obtained by decomposition of the time series of monthly closing share prices (adjusted for splits and dividends) into a weighted sum of two consumer price indices. One might presume that a fast growth in the CPI inherently linked to the AN share price (e.g. energy consumer price for energy companies) relative to some independent by dynamic reference should be manifested in a higher pricing power for the company. Therefore, the task is to find two best (say, in sense of RMS residual error) defining CPIs. It allows testing of the underlying concept (decomposition into CPIs) and to estimate time lags and coefficients for AN.  

We have borrowed the time series of monthly closing prices of AN from Yahoo.com and the relevant (seasonally not adjusted) CPI estimates through September 2012 are published by the BLS.  The evolution of AN share price is defined by the consumer price of rent of primary residence (RPR) and the index of financial service (FS). In March 2012, the defining time lags were as follows: the RPR index leads the price by 10 months and the FS index leads by 5 months. The revised model has only one difference, the lag of RPR is one month longer. The relevant best-fit models for AN(t) are as follows:


AN(t) =  -1.89RPR(t-10) – 0.36FS(t-5)  + 15.47(t-1990) + 270.31,  February 2012
AN(t) =  -1.95RPR(t-11) – 0.37FS(t-5)  + 16.08(t-2000) + 439.34,  September 2012 

where AN(t) is the AN share price in U.S. dollars,  t is calendar time. This model is valid since August 2011 with the same lags and coerffcients. Figure 1 displays the evolution of both defining indices since 2002.  Due to the negative coefficient (slope), the sharp drop in  the FS index in 2009 best explaines the jump in the share price five months later.   

Figure 2 depicts the high and low monthly prices for the share together with the predicted and measured monthly closing prices. The predicted prices are well within the bounds of the share price uncertainty before June 2012 and then the curves deviate. This deviation has been growing and presented the challenge to the model. It also supposed that the probability for the price to fall has been increasing with time. The model residual error is shown in Figure 3 with the standard deviation between July 2003 and September 2012 of $2.01.  

Both CPIs have negative influence on the share price. Therefore, the price should decrease when the indices grow fast.
  

Figure 1. The evolution of the index of rent of primary residency (RPR) and the index of financial service (FS).  

Figure 2. Observed and predicted AN share prices.  


Figure 3. The model residual error: stdev=$2.02.

11/10/12

Aflac Inc. is rather stable in 2012Q4


Here we revisit our stock price model for Aflac Incorporated (AFL). This model was first estimates in March 2011 and has been several times re-estimated with new data. Currently, we have the closing monthly price for October 2012 and the consumer price indices for September 2012. We decompose a share price into a weighted sum of two consumer price indices. This allows linking any share price with relative pricing power of goods and services associated with the company. Accordingly, our goal is to test the original model and to update time lags and coefficients. Overall, the model has demonstrated an excellent predictive power and stability over the whole period since 2011. It can predict at a two-month horizon and the current prediction foresees no significant changes in the AFL price in November-December 2012.  

As in all previous models, the AFL share price is defined by the consumer price index of household furnishing and operations (HFO) and that transportation services (TS). In February 2012, the defining time lags were as follows: the HFO index led the share price by 1 month and the TS by 6 months, but in the current model the first lag in two months. Five relevant best-fit models for AFL(t) are as follows:  

AFL(t) =  -5.02HFO(t-2) – 2.87TS(t-6)  + 20.42(t-1990) + 997.71,  March 2011

AFL(t) =  -4.63HFO(t-0) – 2.90TS(t-5)  + 20.41(t-1990) + 953.49, September 2011

AFL(t) =  -4.63HFO(t-1) – 2.87TS(t-6)  + 20.23(t-1990) + 948.72, December 2011

AFL(t) =  -4.65HFO(t-1) – 2.86TS(t-6)  + 20.20(t-1990) + 949.35, February 2012

AFL(t) =  -4.43HFO(t-2) – 2.71TS(t-6)  + 19.10(t-2000) + 1094.64, September 2012

where AFL(t) is the AFL share price in U.S. dollars,  t is calendar time. 

In March 2012, we predicted that the price would likely not change much in 2012Q1 and it stayed around $45. Figure 1 confirms our prediction. It depicts the high and low monthly prices for an AFL share together with the predicted and measured monthly closing prices (adjusted for dividends and splits). The model residual error ($3.84 for the period between July 2003 and September 2012) is depicted in Figure 2.  

We do not see any large change in the price in November-December 2012 and will revisit the model in January for a new forecast.  


Figure 1. Observed and predicted AFL share prices.  


Figure 2. The model residual error $3.84.

Alcoa's share price may fall to $5 in November-December 2012


We have been regularly reporting on the share price model for Alcoa (NYSE: AA) since April 2011. Here we revisit and update the AA model using new data, including the monthly closing price in October 2012 and the estimated CPI components for September 2012. The principal result is that the model has the same defining CPI components and time lags with slightly changing coefficients. Therefore, the model is a reliable tool to predict the evolution of Alcoa shares. The new observations validate our previous predictions.  Essentially, the model is stable during the past 18 months and forecasts the AA price over the two-month horizon (the consumer price index, CPI, data lag by approximately 20 days behind the monthly closing price of the share). It shows the fall in the price down to $5 in November-December 2012.  

Alcoa is company from Materials subcategory of the S&P 500 list specialized in aluminum. Our concept is intuitive and straightforward. A company is what it produces. There are price setters and price takers. Some goods and services drive economic development and some follow up. Let’s imagine a company producing some goods (services) very attractive to people right now. The company may raise the overall price for its goods (services). Accordingly, stocks go up, likely with some time lag. One of the indicators of the overall price is the consumer price index (CPI) for these specific goods and services or some very intimately related G&S. Then it is not excluded that the company’s share depends on this CPI in a statistically reliable way and one can obtain a good link between the price and this CPI. Since the headline CPI evolves under the pressure of a big set of goods and services, one need to find some dynamics reference (another CPI) which would be most independent on the CPI related to the company. Hence, we have to find two CPIs which describe the evolution of the price the best (in the LSQ sense).  When both CPIs lead the price, a deterministic model can be obtained and we are looking for such companies in the S&P 500 list. Alcoa is one of the companies with a deterministic model – both defining CPIs lead by three months at least.  

According to our general approach to share price modeling, we decompose the observed time history of the monthly closing AA stock price (adjusted for splits and dividends) into a weighted sum of two CPI components, time trend and free term.  Two defining CPI components are selected to minimize the model (RMS) error and may lead or lag behind the share.  

The original and current AA model is defined by the (not seasonally adjusted) index of food away from home (SEFV) and the price index of rent of primary residence (RPR), as reported by the US BLS. The former CPI component leads the share price by 3 months and the latter is 5 months ahead of the share price. Figure 1 depicts the overall evolution of both involved indices through September 2012. It seems these indices have been evolving in sync since 2002 with the only step-like change in the SEFV index in 2008.  We present five empirical models as estimated in April, October, and December 2011 as well as in February and September 2012:
 

AA(t) =  -6.71SEFV(t-2) + 3.34RPR(t-4)  + 19.23(t-1990) + 298.87, Aril 2011

AA(t) =  -6.61SEFV(t-2) + 3.22RPR(t-4)  + 19.51(t-1990) + 300.89, October 2011

AA(t) =  -6.47SEFV(t-3) + 3.08RPR(t-5)  + 19.58(t-1990) + 302.45, December 2011

AA(t) =  -6.38SEFV(t-3) + 3.01RPR(t-5)  + 19.53(t-1990) + 301.93, February 2012

AA(t) =  -6.29SEFV(t-3) + 2.97RPR(t-5)  + 19.26(t-2000) + 491.86, September 2012

where AA(t)  is a share price in US dollars, t is calendar time. Figure 2 illustrates the observed and predicted models for December 2011. The residual error in Figure 3 is $2.91 ($3.05 in December, $3.04 in October, $3.12 in April, and $3.05 in February 2012) for the period between July 2003 and September 2012. Figure 2 also shows monthly high and low prices as the uncertainty in the monthly closing price as the best share price estimate. Since the closing price has to characterise the whole month by one value the high and low prices might serve as strict statistical bounds.


 Figure 1. Evolution of the price of SEVF and RPR.

Figure 2. Observed and predicted AA share prices.

Figure 3. The model error; sterr=$2.91 between June 2003 and September 2012.

11/9/12

Is Apple a lemon?


Here we present a formal model for Apple, AAPL, share price as based on the consumer price index for motor vehicle parts, MVP, and motor vehicle maintenance and repair, MVR:
 
AAPL(t)= 24.31MVP(t-6) – 30.02MVR(t-1) + 169.67(t-2000) + 2618.28  

Figure 1 shows that the predicted (monthly closing) price is much higher than the observed one during the previous two months when the price fell to $592 (end of October)  from $665. The closing price for November 8 is $537.75.  

This model is worthless with the current slump. Is Apple a lemon? This means it is judged emotionally rather than objectively.


Figure 1. The observed and predicted price of Apple share.

11/4/12

The European Monetary Union is the biggest ever victim of economic theory.


Several years of relatively smooth economic evolution in the 1990s (also called the Great Moderation) allowed several economists and bankers in power formulating a new, but obviously wrong, economic paradigm, which included the ability of central banks and governments to control economic and financial systems. In this paradigm, the role of central banks was described in tiny details except what to do when the system is running away. This current crisis was not considered at all and the sad words of Jean-Claude Trichet on the merits of economic models "“as a policymaker during the crisis, I found the available [economic and financial] models of limited help. In fact, I would go further: in the face of the crisis, we felt abandoned by conventional tools”were the best manifestation of his regret that the EMU was built on the basis of these theories and models. I think that the EMU is the biggest ever victim of economic theory. Never trust qualitative sciences and silver-tongue orators. Otherwise, the plane you fly will crash as the EMU.  

Drang nach Osten — «натиск на Восток»

ИИ гугла написал « Drang nach Osten — «натиск на Восток») — это исторический термин, обозначающий германскую экспансию на славянские и восто...