5/9/11

The reason of no economic growth in Tajikistan and Kyrgyzstan

We developed a model for the transition from socialism to capitalism 7 years ago. It described the evolution of real GDP per capita in a parsimonious way. The original model had three defining parameters empirically estimated for a number of former socialist countries. These parameters are:
αs -  the exponent related to the disintegration of the socialist system, which included both depopulation and the free fall in  real GDP per capita;
αc – the growth rate of the number of people in the capitalist part of the overall system during the transition;
α – the rate of endogenous growth of the capitalist subsystem.
Almost all countries have already passed the transition and their populations are fully in the capitalist mode of production. There are few poor examples, however. Tajikistan had an estimated exponent of real GDP per capita growth only 0.5 percent per year and Kyrgyzstan was even worse – 0.0 percent per year. Two figures below show that our model still works accurately. Unfortunately.
The problem is in very slow conversion of their populations into the capitalist system. At the same time, the rate of socialism distraction was very high and a very big portion of the populations is still out of both systems.

Figure. Observed and predicted evolution of real GDP per capita in Tajikistan and Kyrgyzstan both normalized to their levels in 1991.

Economic growth: Russia vs Russia vs USA

There are several ways to estimate real economic performance of a given country. Here we present three different approaches to the case of Russia.
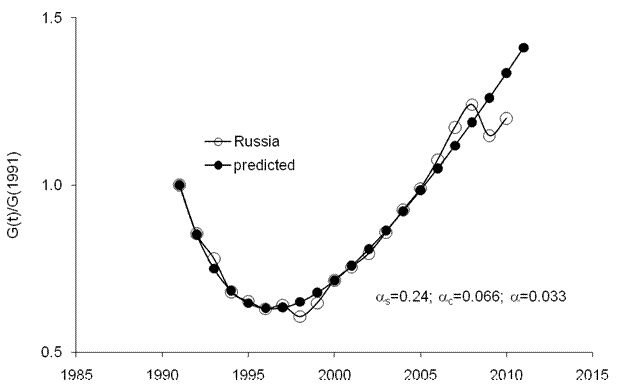
We have modelled the transition from socialism to capitalism in a number of socialist countries. Figure 1 displays the observed and predicted GDP per capita. We used the total economy database published by the Conference Board in 2011 (GK PPPs, 1990 US dollars). Both curves are normalized to their values in 1991. This is the start point of the transition, which was effectively finished around 2000. Since then the Russian economy has been evolving according to general rules applied to capitalist countries. The long term rate of growth was estimated as 0.033 1/y. Figure 1 shows that this rate is likely a good estimate irrelevant to shirt-term deviations. Thus, one can expect that the Russian economy will return to the trend in the near future.

Figure 1. Observed and predicted evolution of real GDP per capita (Geary- Khamis PPPs) in Russia.
Several posts in May 2011 were devoted to the evolution of real GDP per capita in developed countries. We have shown that the difference between the US and other countries has quasi-linear trends. This observation followed from our general (empirically derived) concept of constant annual increment in GDP per capita. This should also work for all former socialist countries turned to the capitalist railway. Russia is not an exclusion as Figure 1 confirms. Thus, Figure 2 compares the mean annual GDP increment for the USA (between 1950 and 2010), which is $387 in 1990 US dollars, and the estimates of annual increment in Russia since 1989. Obviously, it was very slow start because of the transition; real GDP in 1998 was ~60% of its value in 1991.  After 2003, Russia has experienced a period of quick growth with annual increments well above $387. This was a period of good performance. In 2009, all countries suffered a deep fall in real GDP per capita. The year of 2010, looks very average.

Figure 2. Annual increment of real GDP per capita in Russia compared to the long-term average in the USA.
The above comparison with the long-term average demonstrates the healthy pace of the Russian economy in the long-run. This is also valid for the short run. Figure 3 depicts the difference between GDP per capita in the US and Russia between 1990 and 2010. The concept of the constant increment implies that the gap in real GDP can be never decreased since the rate of growth falls inversely proportional to the level of GDP. This means that all former socialist countries will never approach the most developed countries. According to this principle, the gap in Figure 3 must return to the level between $13000 an $1500 in the near future. Russia has been growing too fast in the 2000s. This growth is not likely to be repeated.   

 Figure 3. The difference between real GDP per capita in the USA and Russia.

Krugman on responsibility of elites

It's getting fun to comment on Paul Krugman's posts and columns. The Unwisdom of Elites allows to continue the general critique of the modern economic thought. If one agrees that the elites are responsible for the current and past recessions and other negative economic outcomes s/he must also admit that this kind of mad behavior could be possible only in the context of absolutely irrelevant economic theory. The mainstream economics claims a number of unjustified guesses as real links in developed economies. Since it does not work in reality, the elites can easily ignore these guesses. To give an opposite example, the elites do no ignore laws of physics and thus do not fly planes with empirically unproved  quality. Therefore, the Krugman's critique of the elites is void as based on guesses.

5/8/11

Krugman on low inflation

Krugman is a great supporter of the opinion that the rate of price inflation in  the U.S. will be low in the near  future. In this post he asks fundamental questions related to the real driving force behind inflation:

First, do you see any sign that workers are about to (or are even able to) demand higher wages to compensate for the higher prices of gas and food?

Second, do you any sign that employers are getting ready to make more generous wage offers?

Third, have you heard anything about companies feeling that they have room to raise prices by substantially more than the rise in their raw material costs?

The mainstream economics fails to derive any quantitative model of inflation explaining the  conditions of big changes. This is real reason for the current discussion on the future of inflation in the U.S. Experts do not understand when workers, employers and companies are ready to raise wages and prices. We answered this quastion 6 years ago. It will take another decade  to convince specialists and general public.
Why economists do not trust accurate quantitative prediction?  The answer is obvious - economics  is not a science; and economics profession is  kind a sect.

5/7/11

The history of GDP growth: between Luxembourg and Cyprus

One of interesting consequences of the finding discussed in the previous post is that the gap in GDP per capita between developed countries should be constant or a linear function of time. The former case is possible only when two mean annual increments are equal. When two countries are characterized by different mean annual increments, the gap between their GDP per capita will be growing linearly.

Using the Conference Board Total Economic Database we have estimated the evolution of real GDP per capita in European countries relative to that in the US. In other words, we have calculated differences between countries and the US:

Gus(t)-Gi(t)

, where i runs between Austria and the UK.  GDP is measured in 2010 US dollars at EKS PPPs.
Figure 1 depicts all obtained differences. Luxemburg and Ireland have been growing faster than the US since 1989.  The fastest growing country is Luxembourg according to the Conference Board. Several countries show poor results. Amongst them are Cyprus, Portugal, Italy and Switzerland. Other countries have been slightly lagging behind the US after 1989, except Norway.  Nevertheless, almost all differences are very close to linear functions of time.

The gap in real GDP per capita between these countries and the US is likely forever.


Figure 1. Differences between the US GDP per capita and those in European countries.

1000 arguments against the Solow growth model

In the Solow growth model, the rate of change in real GDP per capita must approach some constant level. This is a result of the following assumption: labor and knowledge grow at constant rates and the rate of capital growth is proportional to the level of output and the rate of capital depreciation. All assumptions are taken without empirical justification. However, actual data on real GDP tell a different story.  

Under the empirical framework we presented in this blog, real GDP per capita in developed countries grows as a linear function of time, we call it inertial growth, when population pyramid does not change much in the long run:

G(t)=At+C                (1)

Relationship (1) defines the linear trajectory of the GDP per capita, where C=Gi(t0)=G(t0) and t0 is the starting time. In the regime of inertial growth, the real GDP per capita increases by the constant value A per time unit. The relative rate of growth along the inertial linear growth trend, g(t), is the reciprocal function of G:

g(t)= A/G(t)         (2)

Relationship (2) implies that the rate of GDP growth will be asymptotically approaching zero, but the annual increment A will always be constant. This is different from the Solow model where the rate of growth is a positive (nonzero) value. Moreover, the absolute rate of GDP growth is constant and is equal to A [$/y]. This constant annual increment thus defines the constant “speed” of economic growth in a one-to-one analogy with Newton’s first law. Hence, one can consider the property of constant speed of real economic growth as “inertia of economic growth” or simply “inertia”.  In Figure 1, we present annual increments of real GDP per capita (borrowed from the Conference Board Total Economic database) in the biggest developed economies as a function of real GDP per capita in sense of equation (1). These plots validate our empirical finding and reject the Solow model. Overall, there were 19 countries analyzed in the study and no one has any distinct positive trend over the past 60 years, i.e. between 1950 and 2010.

In Figure 1, the original GDP time series are extended by those corrected for the ratio of total and working age population (the latter must be used in GDP per capita calculations). For both time series linear regression lines and equations are shown with corresponding slopes. For the biggest countries these slopes are very close to zero but can be positive or negative. A zero slope corresponds to constant annual increment.

So, we have 1000 years validating the hypothesis of a constant (but country dependent) annual increment.


Figure 1. Dependence of annual GDP increment on GDP (both real per capita) for select developed countries. Original GDP data are extended by those corrected for the ratio of total and working age population (the latter must be used in GDP per capita calculations). For both time series linear regression lines and equations are shown with corresponding slopes. For the biggest countries these slopes are very close to zero but can be positive or negative. A zero slope corresponds to constant annual increment.

Back to the future: Ireland versus Japan

In the previous post we mentioned the time history of the Japanese GDP per capita as a template of the future evolution in Ireland. In the 1980s, Japan was very similar to Ireland in between 1995 and 2005.  It demonstrated an outstanding real economic growth, which seemed to last forever. This growth ended in 1991, however, with the past twenty years of mediocre growth.  Ireland suffers the same decease and its fabulous growth ended in 2007. This break was foreseen in 2004 [1]. Figure 1 compares Japan and Ireland in sense of annual increment of real GDP per capita, G. We plot dG (annual) against G because of our empirical finding that dG must converge to constant:
dG=B or G(t)=G(t0) + Bt, where  B is constant and t is the elapsed time.
In Figure 1, the growth in the Japanese GDP per capita between $25000 and $32000 (2010 US dollars) is a template for the Irish growth between $25000 and $45,000. Therefore, we expect the future of real GDP per capita in Ireland to be unpleasant – it has to return to the average value (which is currently  $736) close to the Japanese one ($587).

Figure 1. Comparison of the Japanese and Irish GDP per capita between 1950 and 2010.

Drang nach Osten — «натиск на Восток»

ИИ гугла написал « Drang nach Osten — «натиск на Восток») — это исторический термин, обозначающий германскую экспансию на славянские и восто...