7/24/10

Apple share price. Revision, July 2010

Two months ago we presented a model and made a conservative prediction on AAPL share price. The model for AAPL(t), as introduced in [1], was as following

AAPL(t)= 19.03HFO(t-13) - 10.13HOS(t) + 73.86(t-1990) – 1862.5

where the index of housing furnishing and operations (HFO) leads AAPL(t) by 13 months. The index of housekeeping supplies (HOS) is synchronized with the price.

We also suggested that the price would be not growing at the same pace as in the beginning of 2010. Conditional on the decline in HOS, which was expected in April-July 2010, the share price might decline since May 2010. Figure 1 demonstrates that the actual price has been decreasing since May and this behaviour was well described by the model. One might expect that AAPL share will be falling together with S&P 500 into 2011.


Figure 1. Observed and predicted AAPL share prices.

References

Kitov, I. (2010). Deterministic mechanics of pricing. Saarbrucken, Germany, LAP Lambert Academic Publishing.

Mechanics of Inflation and Unemployment

Our monograph "Economics as Classical Mechanics" is under preparation.
We have compiled a draft version of Section 2.1 of Chapter 2 titled "Mechanics of Inflation and Unemployment". The interested reader may find Section 2.1 in pdf format here.

The contents:

2.1. Inflation, unemployment and labour force in the uSA
2.1.1. The (anti-) Phillips curve
2.1.2. Is labour force driving?
2.1.3. The model and data improvement
2.1.4. Forecasting inflation
2.1.5. Discussion

7/23/10

Mechanics of Gross Domestic Product

We are preparing a new monograph titled “Economics as Classical Mechanics”. This is the central part connecting two previously published monographs: “Mechanics of personal income distribution” and “Deterministic mechanics of pricing”. It is all about macroeconomics: GDP, inflation, unemployment, labor force participation rate, productivity, socialism capitalism transition. First chapater is called “Mecahnics of Gross Domestic Product”. We have prepared a draft version, which is now available here. The contents is as follows:
1.1. Real GDP per capita
1.1.1. The model
1.1.2. GDP per capita in the USA
1.1.3. Real GDP per capita Japan
1.1.4. More developed countries
1.2. Constant annual increment in real GDP per capita
1.3. Cointegration tests
1.4. Real GDP in the United States
1.5. Real GDP and S&P 500 stock market index.
We greatly appreciate any comments and criticism. The final version will likely be submitted by October 2010.


Chapter 2 (Mechanics of Inflation and Unemployment” ) is currently under initial editing and will be available for the interested readers by August 2010.

7/10/10

Deflation is approaching US

At last, deflation is approaching the US. A new post by Mark Thoma @ Economist's View:


How close to deflation are we?


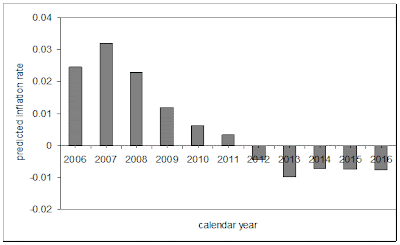
Interstingly, five years ago we calculated that a deflationary period should start in 2012 and publsihed this forecast in 2006: Exact prediction of inflation in the USA.


Below is Figure 9 from this paper. ALl predcitions between 2006 and 2009 were almost absolutely correct. So, inflation has not come yet, but will visit the US soon.

Figure 9. Predicted inflation rate for the period between 2006 and 2016.

Several months ago we presented the same graph with actual inflation readings in this blog:Sure - disinflation continues

7/6/10

First issue of Theoretical and Practical Research in Economic Field

The first issue of TPREF (the whole journal as a pdf file ) is available now. I am an author of one article and a co-editor.

Contents: 1

The Nexus Between Regional Growth and Technology Adoption:

A Case for Club-Convergence?

Stilianos Alexiadis

University of Piraeus …4

7

A Survey on Labor Markets Imperfections in Mexico Using a Stochastic Frontier

Juan M. Villa

Inter-American Development Bank … 97

2

Can Shift to a Funded Pension System Affect National Saving? The Case of Iceland

Mariangela Bonasia

University of Naples

Oreste Napolitano

University of Naples … 12

3

Global Supply Chains and the Great Trade Collapse: Guilty or Casualty?

Hubert Escaith

World Trade Organization … 27

4

Some Empirical Evidence

of the Euro Area Monetary Policy

Antonio Forte

University of Bari … 42

5

Modeling Share Prices of Banks and Bankrupts

Ivan O. Kitov

Institute for the Geospheres‟ Dynamics, Russian Academy of Sciences … 59

6

Infrastructures and Economic Performance: A Critical Comparison Across Four Approaches

Gianpiero Torrisi

Newcastle University … 86

7/5/10

Unemployment In Germany

Approximately a year ago we predicted the rate of unemployment, UE, in Germany at the level of 11% in 2011. This prediction was obtained from the following model linking unemployment and labor force, LF:

UE(t) = 3.2dLF(t-5)/LF(t-5) + 0.08 (1),

where the change in labor force leads the unemployment by 5 (!) years. A comprehensive discussion of the model and data, as retrieved from OECD database, is given in [1].

For this study, we borrowed unemployment estimates from the DEStatis (Federal Statistics Office). They are slightly different from those provided by the OECD, and are issued at a monthly rate.

This is time to revise the prediction and estimates. Figure 1 presents the measured and predicted unemployment rate for the period between 2002 and 2012. All in all, both curves are very close, except the most recent period.

Because of the discrepancy, we have checked the DEStatis for corroborative data on labor force and found new estimates for 2006 through 2009, which are related to national concept. When (1) is applied, one obtains the open triangle curve with the new estimates.

We still consider the level of 11% in 2011 as a reliable estimate. From 2001 to 2009 relationship (1) worked well with the estimates of labor force from the OECD.

However, there is a possibility that the new estimates of labor force are not too bad, and actual unemployment in 2011 will not be above 10%. In 2010 the rate will reach the level between 8% and 9%.

This is a good example that one can predict the future evolution of macroeconomic variables, but the past is unpredcitable. It is a common feature when statistical agencies revise their past estimates.


Figure 2. Observed and predicted rate of unemployment in Germany.


7/2/10

Second half of 2010 - second wave of crisis

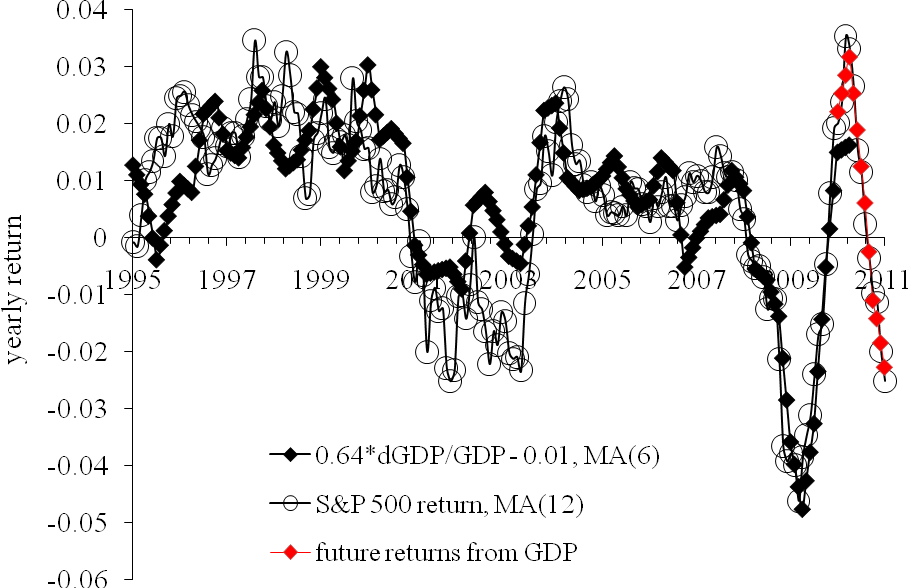
As discussed in our working paper, there exists a trade-off between the growth rate of real GDP, G(t), and the S&P 500 returns, R(t). The predicted returns, Rp(t), can be obtained from the following relationship:

Rp(t) = 0.0062dlnG(t) - 0.01,

where G(t) is represented by (six month moving average) MA(6) of the (annualized) growth rate during six previous months or two quarters, because only quarterly readings of real GDP are available.

Figure 1 displays the observed S&P 500 returns and those obtained using real GDP, as presented by the US Bureau of Economic Analysis. The observed returns are MA(12) of the monthly returns. The period after 1996 is relatively well predicted including the increase in 2003. Therefore, it is reasonable to assume that G(t) can be used for modeling of the S&P 500 index and returns. Reciprocally, current S&P 500 may be used for the estimation of GDP.

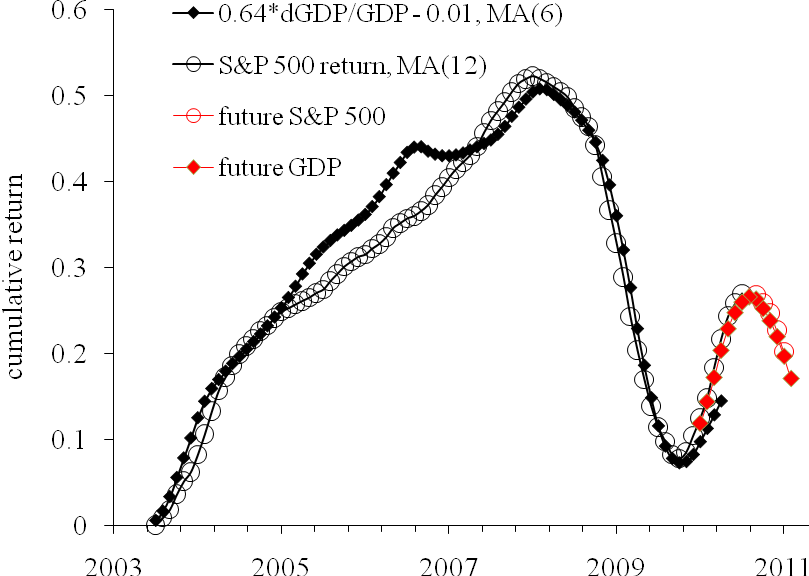
In the previous article, we have predicted the future of S&P 500 and its returns. Now we invert the predicted figures and calculate real GDP for the same period. The bets-fit GDP figures are obtained from the cumulative curves shown in Figure 2. Our estimates from 2009Q3 to 2010Q4 are shown by red circles and red diamonds. The estimated GDP growth rates are as follows:
2009Q3: 3% (2.2%)
2009Q4: 7% (5.6%)
2010Q1: 6% (2.6%)
2010Q2: +2%
2010Q3: -2%
2010Q4: -3%

In the brackets, the current estimates of the growth rate of real GDP are given, which will be all revised in July 2010. So, our model shows that GDP was slightly underestimated in the second half of 2009 and heavily underestimated in the first quarter of 2010. In 2010Q2 the growth will slow down and then a period of GDP contraction will start. Some people call it the second wave of crisis. This is what our model foresees.

Figure 1. Observed and predicted S&P 500 returns 1985 to 2011.The future S&P 500 returns are converted into GDP growth rates. Corresponding re-estimates of the returns are shown by red diamonds.

Figure 2. Cumulative observed and predicted S&P 500 returns. Red diamonds represent GDP figures which fit the predicted S&P 500 returns.

Recovery of low-magnitude seismic events before the July 29, 2025, Kamchatka megathrust earthquake using waveform cross-correlation enhanced by the addition of stochastic noise

 Recovery of low-magnitude seismic events before the July 29, 2025, Kamchatka megathrust earthquake using waveform cross-correlation enhance...