The US economy is likely approaching a period of very low, if not negative,
price inflation. Our analysis shows that the consumer price index, CPI, will lag
behind the core CPI. Deflation is dark time for investors, as the case of Japan
unambiguously demonstrates.
The core CPI is often used as a reliable estimate of inflation trends over longer time horizons. It is a well-known fact that the monthly CPI readings reported by the BLS are highly volatile and may give misleading signals on the long-term trends. Usually the prices of food and energy are excluded from the headline CPI in order to obtain a smoother time series. The food and energy prices are considered as having higher volatilities which are responsible for the largest fluctuations observed in the CPI. Therefore, it is implied that the core CPI just misses a stochastic process with a large standard deviation. However, in the long ran the relative evolution of the core and headline CPI is more informative than a simple stochastic time series.
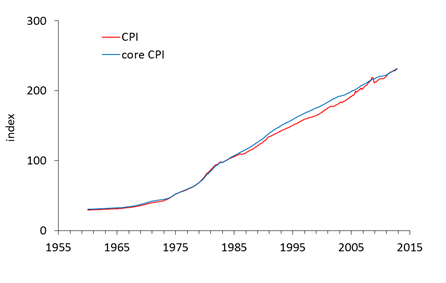
Figure 1 illustrates the evolution of the measured CPI and core CPI in the USA after 1957. Unfortunately, no estimates of the core CPI are available before 1957. Both indices are for all urban customers and seasonally adjusted. In Figure 1, one can observe that the curves are very close before 1980 - the core CPI practically evolved in sync with the CPI. After 1981, the curves diverge with the core CPI growing faster than the CPI. The gap between the indices widens through 2000, and then the curves start to converge and coalesce in the first quarter of 2011.

Figure 1. The evolution of the headline and core CPI in the USA.
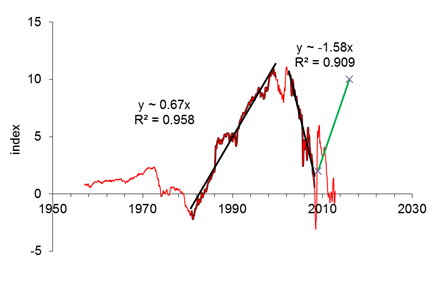
A better view on the periods of the CPI and core CPI divergence and convergence is represented by the difference between these variables, as displayed in Figure 2. The difference is apparently characterized by the presence of three distinct segments of quasi-linear trend and two short transition periods. Between 1960 and 1978, the difference is relatively stable and varies in a narrow range around +1 unit of index. Between 1979 and 1982, the curve falls to -2 and then suddenly changes its direction. From 1982 to 1999, the core CPI is growing consistently faster and a gap of about 10 units is created. The curve between 1982 and 1999 is well approximated by a straight line with small-amplitude deviations; the latter might be associated with measurement noise. The slope of the linear regression line presented in Figure 2 is -0.7 with R2=0.96. In other words, during these eighteen years the headline CPI was growing by 0.7 units of index faster than the core CPI.
There was another period of high volatility between 1999 and 2002 similar to that observed between 1979 and 1982. The gap reached its peak value two times - in 1999 and in 2003. Since 2003, the gap has been closing in line with a faster growing headline CPI, i.e. the food and energy prices had higher rates of growth. Nevertheless, the CPI was consistently below the core CPI, as Figure 1 demonstrates. In 2008, we extrapolated the observed rate of convergence between the CPI and core CPI and estimated the intercept time somewhere between 2009 and 2010 (here we ignore a short term spike in oil prices in 2008). This negative linear trend was also very reliable with R2=0.91. The convergence was faster - approximately 1.6 units of index per year.
When extrapolated the structure of the difference into the future, we suggested that it would be increasing during the next 8 years as a mirror reflection of the trend observed between 2002 and 2008. The projected trend is shown by green line in Figure 2. Since 2008, the actual curve was above and below the green line. Seemingly, we have missed an important feature of the difference which is best seen in a different representation.

Figure 2. The difference between the core and headline CPI.
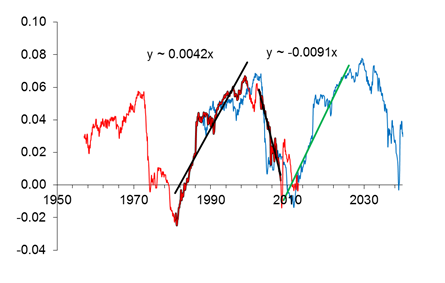
Figure 3 displays the studied difference normalized to the headline CPI. The pattern is essentially the same as in Figure 2, except the fall in the 1970s, which now has a similar amplitude and duration as the fall between 2003 and 2008. The slope change is almost negligible: from 0.42 in Figure 2 to 0.46 in Figure 3. A striking new feature is the curve self-similarity, which is clear when we shifted the original curve by 30 years ahead (blue line). In other words, the normalized difference is periodic with a period of 30 years. The periodicity suggests a different future, as expressed by a green line with a slope 0.0042. This quasi-linear trend extends into the late 2020s.
In 2012, the normalized curve in Figure 3 returned to the trend. It is highly probable that the rate of CPI growth will fall below that of the core CPI. Equivalently, the joint input of food and energy in the overall price inflation will be declining with time. However, the trajectories of food and energy price evolution are not necessary to be the same.

Figure 3. The evolution of the difference between core and headline CPI normalized to the headline CPI. Blue line represents the original curve shifted by 30 years ahead. The new trend is shown by green line.
If to assume that the evolution of the core and headline CPI is driven by independent stochastic processes like random walks, then the deviation between these indices would be a stochastic process itself. From Figure 3, it is more reasonable to assume, however, that there is a tight link between these variables, which provides the observed repeated shape of the normalized difference. For purely stochastic and independent variables such a periodic behavior is highly unlikely.
There are several simple conclusions from the existence of periods and linear trends in the difference between the CPI and core CPI. Firstly, the consumer prices of food and energy are driven by forces which are independent on those behind other goods and services. Secondly, there are breaks in these forces, when the direction of action reverses. Thirdly, one can extrapolate the evolution of the difference between the CPI and core CPI at a horizon of about twenty five years. Fourthly, there exist relatively short transition periods. These periods are characterized by an elevated volatility.
The core CPI is often used as a reliable estimate of inflation trends over longer time horizons. It is a well-known fact that the monthly CPI readings reported by the BLS are highly volatile and may give misleading signals on the long-term trends. Usually the prices of food and energy are excluded from the headline CPI in order to obtain a smoother time series. The food and energy prices are considered as having higher volatilities which are responsible for the largest fluctuations observed in the CPI. Therefore, it is implied that the core CPI just misses a stochastic process with a large standard deviation. However, in the long ran the relative evolution of the core and headline CPI is more informative than a simple stochastic time series.
Figure 1 illustrates the evolution of the measured CPI and core CPI in the USA after 1957. Unfortunately, no estimates of the core CPI are available before 1957. Both indices are for all urban customers and seasonally adjusted. In Figure 1, one can observe that the curves are very close before 1980 - the core CPI practically evolved in sync with the CPI. After 1981, the curves diverge with the core CPI growing faster than the CPI. The gap between the indices widens through 2000, and then the curves start to converge and coalesce in the first quarter of 2011.

Figure 1. The evolution of the headline and core CPI in the USA.
A better view on the periods of the CPI and core CPI divergence and convergence is represented by the difference between these variables, as displayed in Figure 2. The difference is apparently characterized by the presence of three distinct segments of quasi-linear trend and two short transition periods. Between 1960 and 1978, the difference is relatively stable and varies in a narrow range around +1 unit of index. Between 1979 and 1982, the curve falls to -2 and then suddenly changes its direction. From 1982 to 1999, the core CPI is growing consistently faster and a gap of about 10 units is created. The curve between 1982 and 1999 is well approximated by a straight line with small-amplitude deviations; the latter might be associated with measurement noise. The slope of the linear regression line presented in Figure 2 is -0.7 with R2=0.96. In other words, during these eighteen years the headline CPI was growing by 0.7 units of index faster than the core CPI.
There was another period of high volatility between 1999 and 2002 similar to that observed between 1979 and 1982. The gap reached its peak value two times - in 1999 and in 2003. Since 2003, the gap has been closing in line with a faster growing headline CPI, i.e. the food and energy prices had higher rates of growth. Nevertheless, the CPI was consistently below the core CPI, as Figure 1 demonstrates. In 2008, we extrapolated the observed rate of convergence between the CPI and core CPI and estimated the intercept time somewhere between 2009 and 2010 (here we ignore a short term spike in oil prices in 2008). This negative linear trend was also very reliable with R2=0.91. The convergence was faster - approximately 1.6 units of index per year.
When extrapolated the structure of the difference into the future, we suggested that it would be increasing during the next 8 years as a mirror reflection of the trend observed between 2002 and 2008. The projected trend is shown by green line in Figure 2. Since 2008, the actual curve was above and below the green line. Seemingly, we have missed an important feature of the difference which is best seen in a different representation.

Figure 2. The difference between the core and headline CPI.
Figure 3 displays the studied difference normalized to the headline CPI. The pattern is essentially the same as in Figure 2, except the fall in the 1970s, which now has a similar amplitude and duration as the fall between 2003 and 2008. The slope change is almost negligible: from 0.42 in Figure 2 to 0.46 in Figure 3. A striking new feature is the curve self-similarity, which is clear when we shifted the original curve by 30 years ahead (blue line). In other words, the normalized difference is periodic with a period of 30 years. The periodicity suggests a different future, as expressed by a green line with a slope 0.0042. This quasi-linear trend extends into the late 2020s.
In 2012, the normalized curve in Figure 3 returned to the trend. It is highly probable that the rate of CPI growth will fall below that of the core CPI. Equivalently, the joint input of food and energy in the overall price inflation will be declining with time. However, the trajectories of food and energy price evolution are not necessary to be the same.

Figure 3. The evolution of the difference between core and headline CPI normalized to the headline CPI. Blue line represents the original curve shifted by 30 years ahead. The new trend is shown by green line.
If to assume that the evolution of the core and headline CPI is driven by independent stochastic processes like random walks, then the deviation between these indices would be a stochastic process itself. From Figure 3, it is more reasonable to assume, however, that there is a tight link between these variables, which provides the observed repeated shape of the normalized difference. For purely stochastic and independent variables such a periodic behavior is highly unlikely.
There are several simple conclusions from the existence of periods and linear trends in the difference between the CPI and core CPI. Firstly, the consumer prices of food and energy are driven by forces which are independent on those behind other goods and services. Secondly, there are breaks in these forces, when the direction of action reverses. Thirdly, one can extrapolate the evolution of the difference between the CPI and core CPI at a horizon of about twenty five years. Fourthly, there exist relatively short transition periods. These periods are characterized by an elevated volatility.


No comments:
Post a Comment