In this post, we revisit a share price model for Procter and Gamble as based on the decomposition into a weighted sum of two consumer price indices (to be determined), linear time trend and constant. It is shown that the model is valid since September 2009 at least and does not show any sign of possible failure. It predicts the share price at a four month horizon.
A share price model for Procter and Gamble (NYSE: PG) was originally published in this blog in July 2010. According to our concept, it was defined by the index of food away from home (SEFV - CUUS0000SEFV) and that of rent of primary residency (RPR); the evolution of these indices is presented in Figure 1. The former CPI component led the share price by 3 months and the latter one led by 8 months. The upper panel of Figure 2 depicts the original model and the monthly closing prices available in July 2010. This model was stable for the previous 11 months, i.e. for the period from September 2009.
In April 2010, we updated the original model using some new data (closing price for March 2011) and found that the same model was also applicable with a small change in the time lead for the SEFV – it was 4 months instead of 3 months in the original model. New coefficients were also slightly different, but very close to the original ones.
The most recent update uses the monthly closing price for September 2011 and CPIs for August 2011. It validates the model obtained for the previous period but is characterized by the same time lags and a small shift in the coefficients estimated by the LSQ technique. Three best-fit models for PG(t) are as follows:
PG(t) = -5.88SEFV(t-3) + 3.43RPR(t-8) + 17.60(t-1990) + 174.08, July 2010
PG(t) = -5.40SEFV(t-4) + 2.93RPR(t-8) + 18.16(t-1990) + 187.47, March 2011
PG(t) = -4.94SEFV(t-4) + 2.47RPR(t-8) + 18.15(t-1990) + 184.89, September 2011
where PG(t) is the monthly closing price (dividend and split adjusted) in US dollars, t is calendar time.
In the lower panel of Figure 2, the predicted curve leads the observed price by 4 months with the residual error of $2.12 for the period between July 2003 and September 2011 (see Figure 3 for the model residuals). In other words, the price of a PG share is completely defined by the behaviour of these two CPI components.
The model does predict the share price in the past and foresees a period of no growth in the fourth quarter of 2011. In January 2012, the price may fall, but we should revise the model with new data by that time.

Figure 1. Evolution of the price of SEFV and RPR.

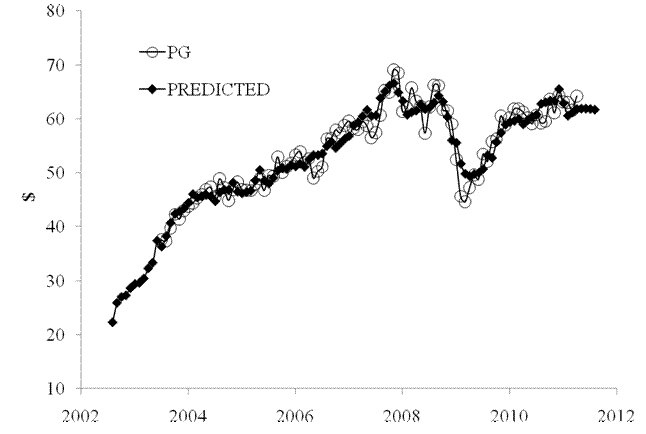

Figure 2. Observed and predicted PG share prices. In the upper panel, the original prediction published in July 2010 with a three month lead shown by red line. The middle panel – the model published in April 2011. The lower panel – the most recent model with the monthly closing price for September 2011.

Figure 3. The model residual error.
No comments:
Post a Comment