The approach is straightforward:
1. To calculate the overall price inflation, p. We prefer monthly estimates taken on year to year basis. So, we calculate the relative increase in corresponding price index during the past 12 months:
p(t)= [P(t)-P(t-12)]/P(t-12),
where P(t) is the consumer price index, t is time in months.
2. To calculate individual price inflation, pi, for given subcategory of the CPI. Without loss of generality, I have chosen eggs, butter, juice, and coffee. (The index of bread was started only in 2005 and thus omitted.) It is also instructive to estimate the price inflation of food.
3. To calculate the relative price inflation, i.e. subtract the p(t) from all pi(t).
Figure 1 displays the differences between individual rates of price inflation and the overall inflation. In 2010, all prices, except that for butter, have been growing at a lower rate than the overall price index. In relative terms, each breakfast is getting cheaper, if you do not eat butter.
A researcher and likely investor may have additional fun from Figure 2, where the relative inflation of food and juice is shown. Since 2005, both curves are similar in timing of main peaks and through and their amplitudes. I would say that juice price has been chasing the overall price.
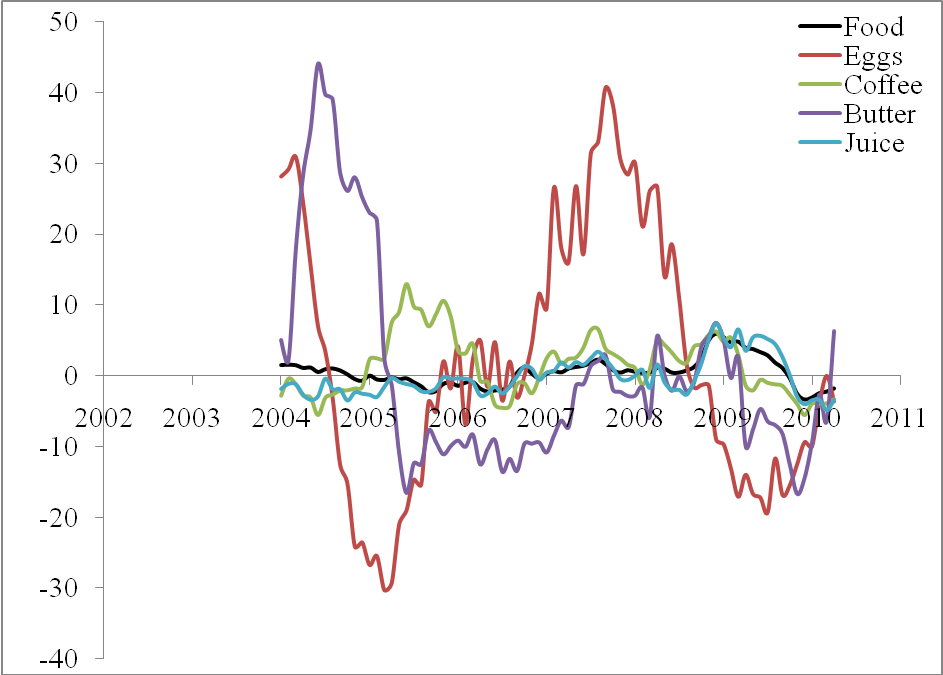
Figure 1. Relative price inflation of food, eggs, coffee, juice, and butter. Since the beginning of 2010, all prices have been growing at a lower rate than the CPI, except that of butter.
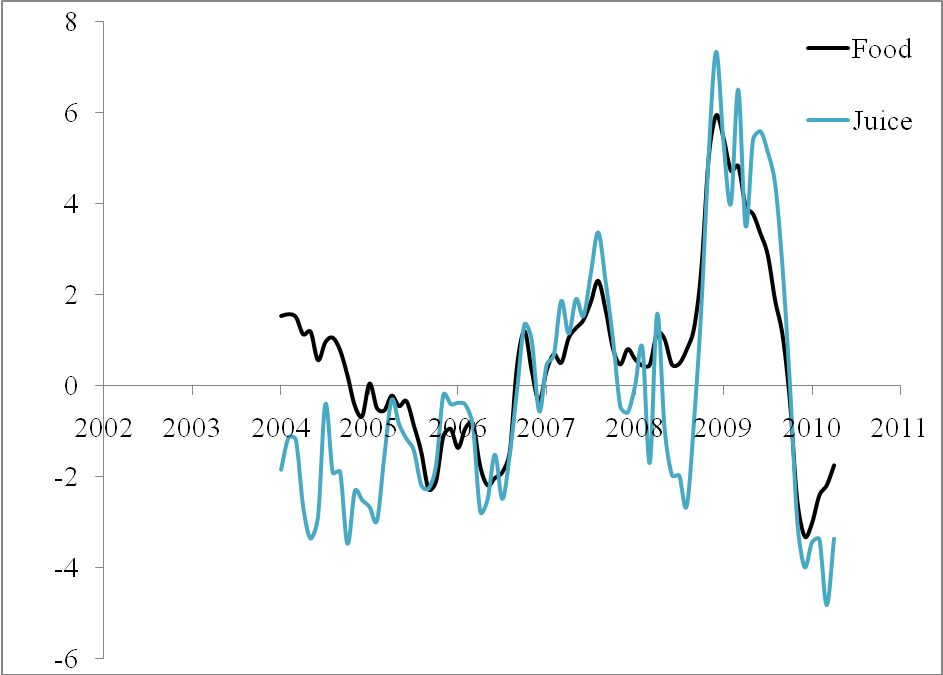
Figure 2. Same as in Figure 1 for food and juice


No comments:
Post a Comment