About a year ago we published a prediction for copper and grain:
Therefore, copper price will likely not be growing to its peak in April 2008 (491.7), but will likely return to heights around 350.
In the short-run, the index for copper will be growing at least till the end of 2009. The index for grains will continue its decline relative to the PPI. As a consequence, one can expect that the index for food will be also decreasing and this decline will stretch into the 2010s.
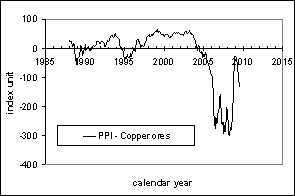
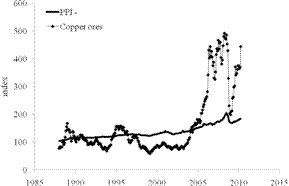
Figure 1 compares the prediction and actual behavior for the producer price index of copper ores relative to the overall PPI. All in all, the prediction was right: by the end of 20009 the price index of copper has reached the level of 350 (375) and even higher in the beginning of 2010 (443 in April). However, it has not reached the 2008 level. It is difficult to foresee further evolution, but one cannot exclude the price to grow beyond that in 2008.
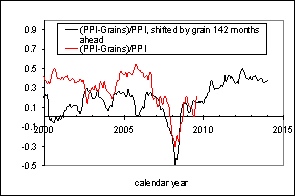
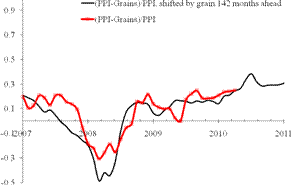
Figure 2 illustrates the accuracy of our prediction of the index of grains. The index has been falling relative to the PPI and the trajectory actually repeats that observed 142 months before, as explained the previous post:
It is instructive to compare two major spikes in the grains index in 1996 and 2008 relative to the PPI. In order to avoid comparing absolute values, which undergo secular growth, the evolution of the difference between the PPI and the price index of grains normalized to the PPI. Figure 3 presents the normalized curves. The left panel shows that the spike in the grains PPI in July 1996 is similar in relative terms to that observed in 2008. The right panel tests this hypothesis: the spikes are synchronized - for the black line is shifted forward by 142 months. From this comparison, it is likely that decline in the grains index relative to the PPI will extend into the 2010s.


Figure 1. Evolution of the price index of copper ores relative to the PPI. Upper panel: September 2009. Lower panel: April 2010.


Figure 2. Evolution of the difference between the PPI and the price index of grains normalized to the PPI. Left panel: September 2009. Right panel: April 2010.
Short term prediction
In the short-run, the index for copper will NOT be growing too long, at least NOT till the end of 2010. The index for grains will continue its decline relative to the PPI. As a consequence, one can expect that the index for food will be also decreasing and this decline will stretch into the 2011.
We can also repeat the conclusion from the post one year ago
In the long run, the producer price index for copper and that of grains both demonstrate practically unpredictable behavior with unclear future. This observation only emphasizes the importance of sustainable trends observed for other commodities. In the US economy, as in many natural systems, there exist trend components, oscillating components, and random components.


No comments:
Post a Comment