The US economy was and is successful, as many people think. Such a view on the economy prevails because the long-term evolution is not discussed by the economic and financial authorities and mainstream experts. Here, I would like to present the US economic performance with the long-term trends in key economic parameters since 1960. These parameters are the growth rate of the civilian noninstitutional population, CNP, the rate of real GDP growth, the rate of real GDP per capita growth, the labor force growth rate, and the labor force participation rate. The population-related parameters are key to the understanding of long-term evolution.
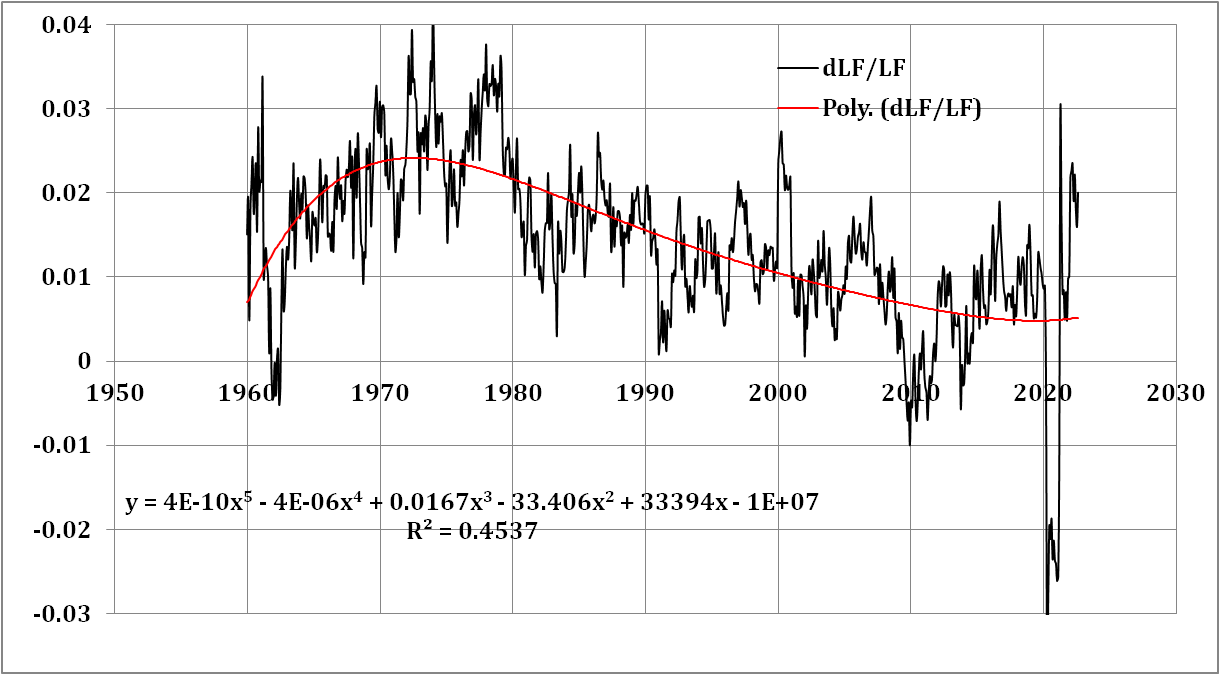
We start with the CNP as the source of mechanical economic growth, i.e. the economy is growing even if the labor productivity does not increase. Figure 1 shows the rate of CNP growth between 1960 and 2022, as reported by bls.gov. The CNP growth rate curve is weird due to population corrections, especially popular in the 21st century. The polynomial trendline gives a clear picture of the long-term decline in the population growth rate from approximately 2% per year near 1970 to the current level below 0.05% per year. The period after 2012 is the worst since 1960. Therefore, the mechanical growth of the US economy was around 1% to 1.5% per year between 1980 and 2010 and then dropped by a factor of 2 or more. It is worth noting that the rate of population growth in European countries was much lower since 1960 and the mechanical part of economic growth was small.

Figure 1. The rate of CNP growth with a polynomial trendline. The growth rate is calculated for the monthly estimates relative to the previous year. The population corrections are clearly seen in the curve as one-year-long spikes smoothing the year-to-year jumps in the CNP estimates.
The population influence on real economic growth can be well illustrated by the comparison of the real GDP and GDP per capita as presented in Figure 2. Two trendlines in Figure 2 demonstrate an almost constant difference between 1960 and 2010 supported by a healthy population growth above 1% per year and a sudden convergence as driven by a quick decline in the CNP growth rate. The mechanical growth of the US economy suffers a dramatic decline and the open border policy of the current administration may bring the mechanical part of economic growth back to the pre-2010 level. Some European countries also follow this kind of wisdom to speed up their economic growth.
In any case, Figure 2 shows that the US economy lost its historic momentum and the future is not clear as demonstrated by the long-term decline in the growth rate (both real GDP and GDP per capita). For example, the GDPpc growth rate fell from 3% per year in the 1960s to 1.3%-1.5% in the 2010s. Correspondingly, the real GDP growth rate was around 2% per year in the 2010s while the CNP growth rate was around 0.5% per year. The long-term decline in the real GDP per capita has a fundamental character as explained by the observation that the GDPpc growth rate is inversely proportional to the attained level of GDPpc. The following functional dependence describes this relationship: dGDPpc/dt= A/GDPpc, where A is a country dependent constant. We thoroughly discussed this relationship in this blog and in our book. This decline in growth rate is the cost of real economic growth. The countries with lower GDP per capita can grow much faster in relative terms, but the annual increment per capita, A, is the fundamental parameter defining the efficiency of economic performance. For example, the economic growth in China is very quick in relative terms but is lower in absolute terms. For one person, the increment in dollars in China is lower than in the USA. For the most recent estimates, we recommend the following paper.


No comments:
Post a Comment